Consumer Discretionary Is Beaten Down. Whose Books Still Look Strong?
sector_score readings from Stocklake's sector intelligence, last updated Friday, Sept 25A lot of investors have the same habit when a sector gets hammered. They don't buy the sector. They go looking inside it for the companies whose numbers didn't break, the ones that got marked down with everything else while their margins, balance sheets and cash flow held up. Sometimes the price drop is telling you something real about a business. Sometimes it's just the whole group being sold at once.
Telling those two apart used to mean a sector dashboard, a screener, and an afternoon reading annual reports. This post does it in three prompts: an AI agent (Claude, ChatGPT or another) with Stocklake connected, working through consumer discretionary stocks as of the close on Friday, Sept 25.
Step 1: check the premise with numbers
“Consumer discretionary is getting crushed” is a feeling until you check it. So the first prompt asks the agent to prove it, and to put the sector next to the other ten.
get_sector_intelligence, get_market_assessment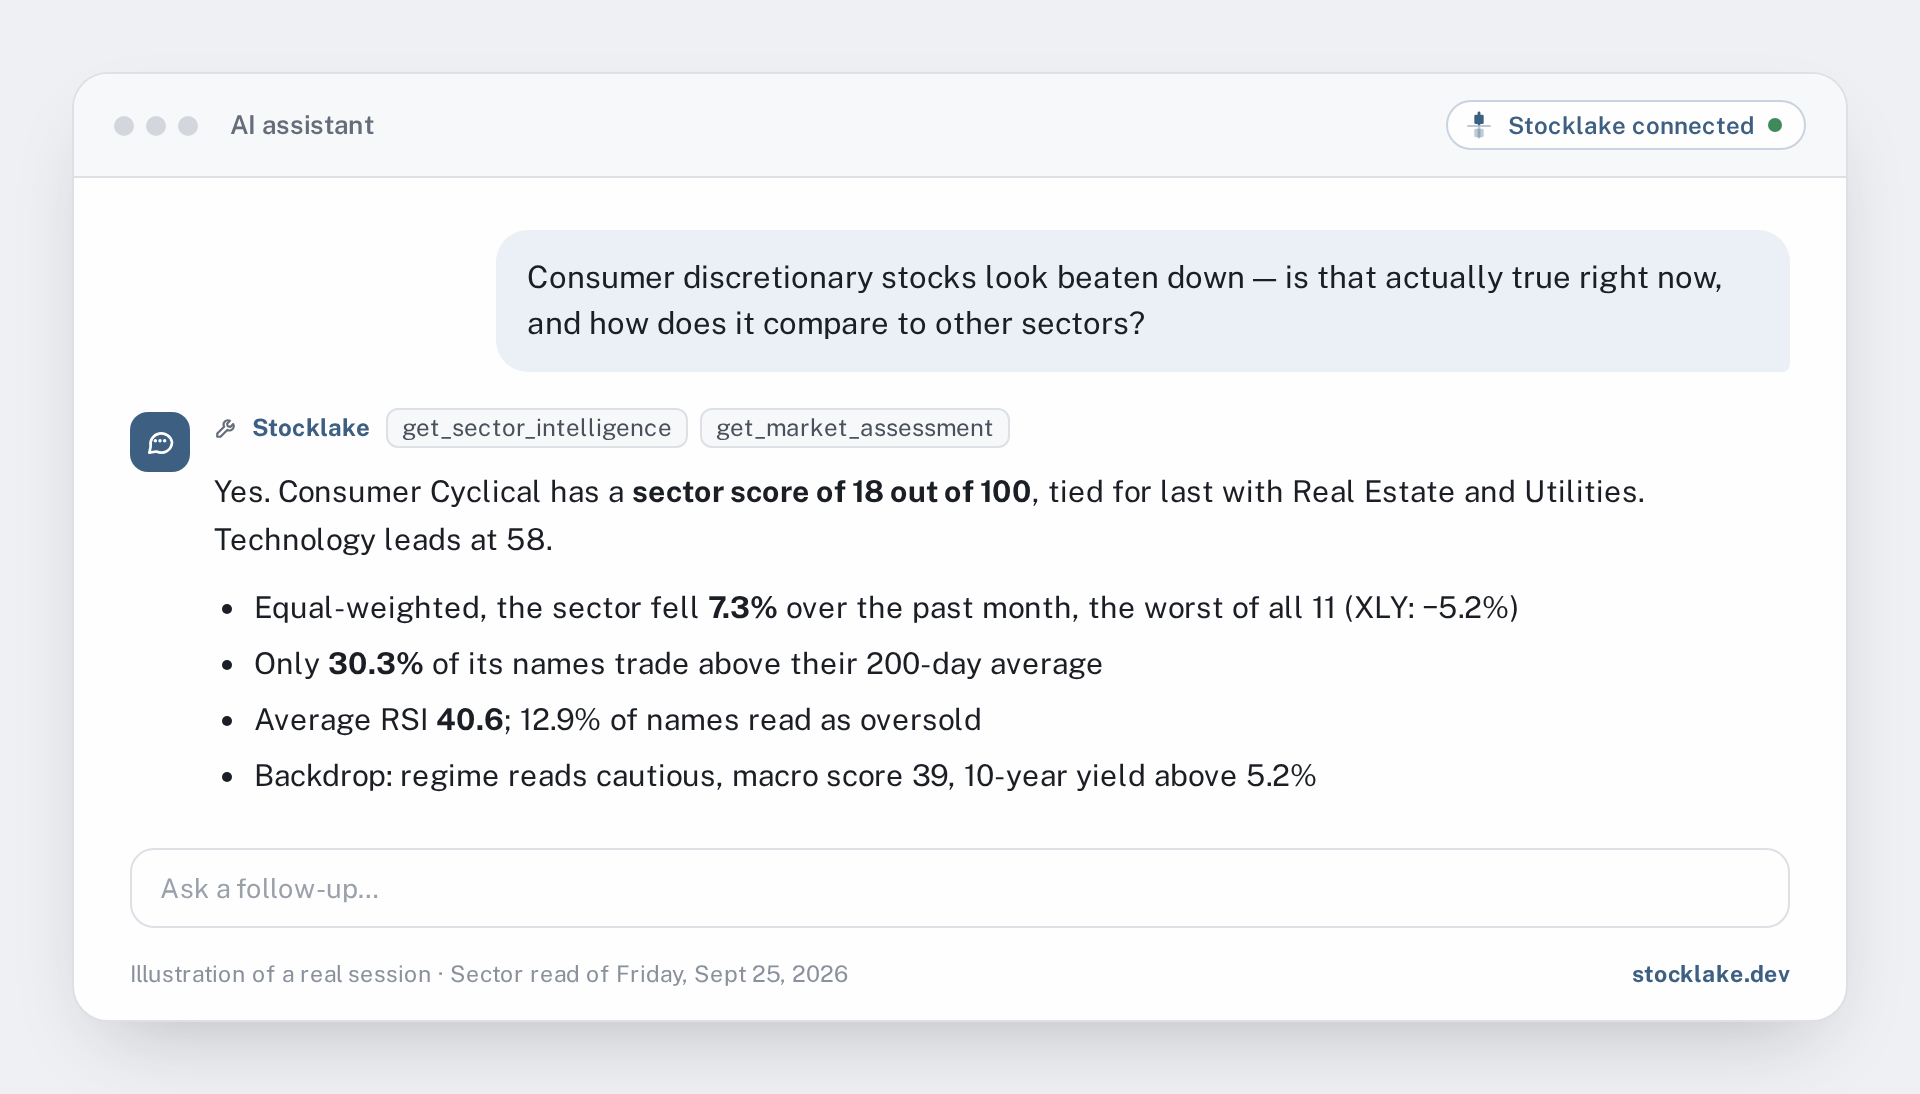
It holds up. Stocklake files consumer discretionary as Consumer Cyclical, and on the latest sector read (Friday, Sept 25) it had a sector_score of 18 out of 100. That ties it for last with Real Estate and Utilities. Technology sat at the top with 58. The rest of the picture points the same way:
- Equal-weighted, the sector fell 7.3% over the past month, the worst of all 11 sectors. The cap-weighted ETF, XLY, was down 5.2%, so the damage runs deeper than the biggest names.
- Only 30.3% of its names were trading above their 200-day moving average.
- Average RSI across the sector was 40.6, and 12.9% of its names read as oversold.
The market backdrop explains part of it. Stocklake's market assessment read the regime as cautious, with a macro score of 39 and the 10-year Treasury yield above 5.2%. Higher yields weigh on companies that depend on people choosing to spend. So the sector is genuinely down, broadly, not because of one or two names. That's the setup the habit is looking for.
Step 2: the screen
Next comes the actual question. Which companies in the sector are well off their highs but still look healthy on the financials?
get_screener, get_stocks, get_stock_financials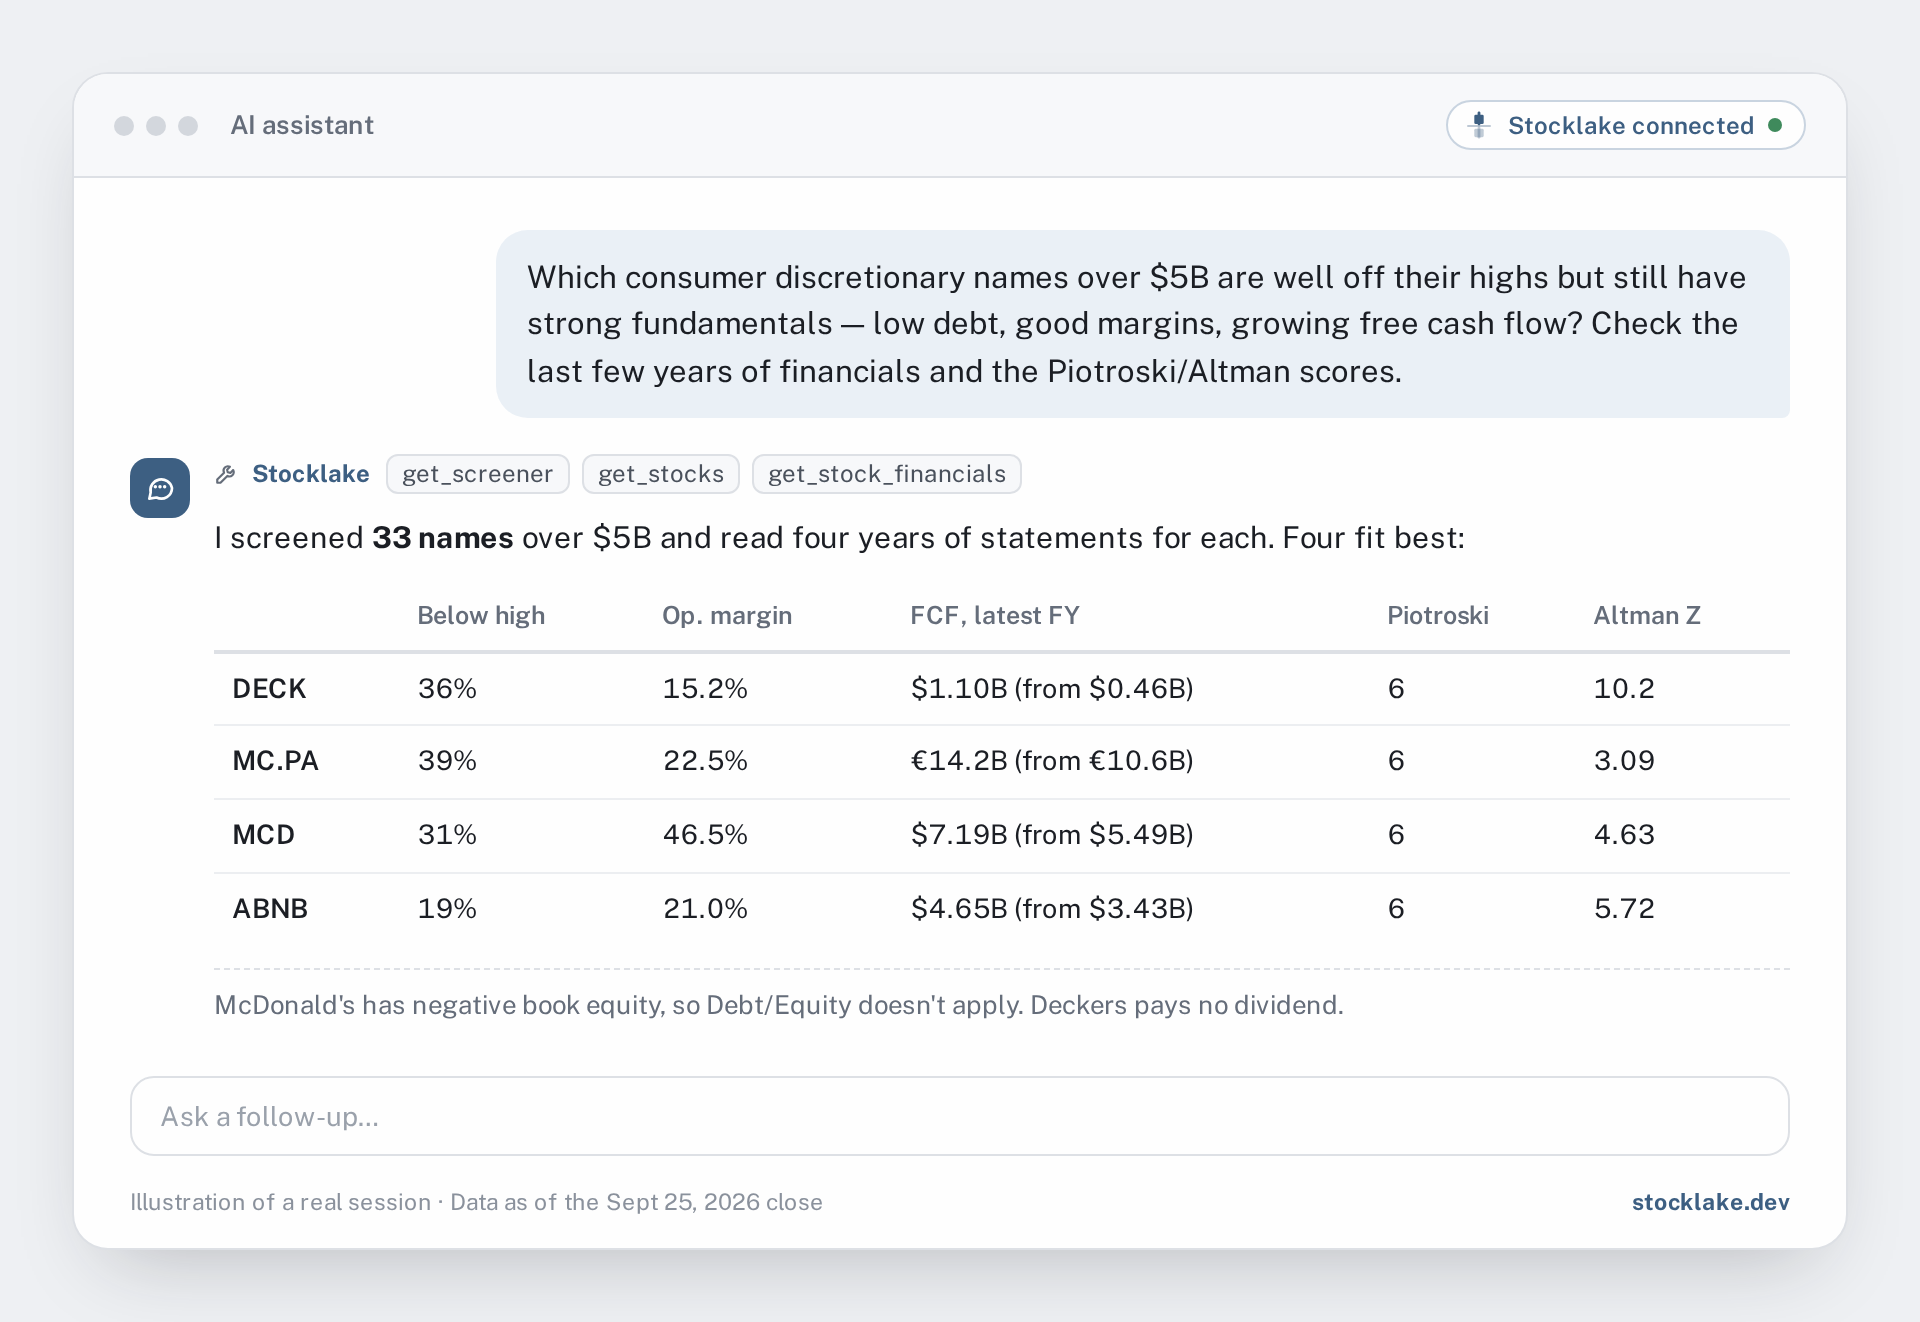
The agent started with the free screener: every Consumer Cyclical name with a market cap of at least $5 billion, which came to 33 companies. For each one it pulled price and distance from the 52-week high, then several years of income statements, balance sheets and cash flow statements, plus the Piotroski F-Score and Altman Z-Score. Four names came back as the strongest fits.
| Company | Price | Below 52w high | Debt/Equity | Op. margin | Free cash flow, latest FY | Rev. growth | Div. yield | Piotroski | Altman Z |
|---|---|---|---|---|---|---|---|---|---|
| DECK | $78.67 | 36% | 21% | 15.2% | $1.10B (FY Mar-26), up from $0.46B | +5.7% | none | 6 | 10.2 safe |
| MC.PA | €396.85 | 39% | 53% | 22.5% | €14.2B (FY25), up 3 years running from €10.6B | −2.9% | 3.3% | 6 | 3.09 safe |
| MCD | $236.50 | 31% | n/a (negative equity) | 46.5% | $7.19B (FY25), up from $5.49B | +3.7% | 3.3% | 6 | 4.63 safe |
| ABNB | $157.47 | 19% | 32% | 21.0% | $4.65B (FY25), up from $3.43B | +16.5% | none | 6 | 5.72 safe |
None of the four is clean on every line, and the agent said so. Here is what the numbers show, including the catch on each.
Deckers (DECK)
The strongest balance sheet of the group. Debt/Equity of 21% and an Altman Z of 10.2, far into the safe zone. Free cash flow more than doubled since fiscal 2023, to $1.10 billion, and it funded $1.08 billion of share buybacks. Revenue grew 5.7% in the latest quarter, and the stock trades around 9.4 times forward earnings while sitting 36% below its high. The catch: Deckers pays no dividend, so if income is part of what you're screening for, it drops out.
LVMH (MC.PA)
Free cash flow has risen three years in a row, to €14.2 billion, and it covers the €6.5 billion dividend about 2.2 times. The operating margin is 22.5%. The catch: revenue slipped 2.9%, so this is a strong cash business in a slow patch rather than a growing one. It's also a reminder that the screen isn't US-only: LVMH is listed in Paris and reports in euros, and it went through the same financial statements and scores as everything else.
McDonald's (MCD)
A 46.5% operating margin, the highest here, and free cash flow up to $7.19 billion from $5.49 billion. In the latest quarter revenue rose 3.8% and earnings per share 5.7%. The catch: McDonald's has negative book equity after years of buybacks, so a Debt/Equity ratio doesn't mean anything for it. That's why the table shows n/a. The agent flagged this rather than treating the missing ratio as a pass.
Airbnb (ABNB)
The only double-digit grower of the four, with revenue up 16.5%, and free cash flow up to $4.65 billion. The catch comes in two parts. At 19% below its high it is the least beaten down of the group, so it fits the “well off its highs” part of the prompt only loosely. And its free cash flow includes about $1.6 billion of stock-based compensation, which is a real cost to shareholders even though it doesn't leave as cash.
One more thing is worth noticing. Several of these numbers aren't fields Stocklake's MCP tools return. LVMH's dividend cover, the doubling of Deckers' free cash flow and the multi-year trends are worked out from the raw statements. Raw financials go in, the arithmetic happens in the conversation, and you can ask it to show the rows it used.
Three near misses are worth a line each, because the reasons they missed are instructive. Domino's has a Piotroski score of 8 but negative equity. Tapestry also scores 8 on Piotroski, but carries Debt/Equity of 5.7 times. PulteGroup has a clean balance sheet, but its revenue fell 9.6%.
Step 3: cheap on price, weaker under the hood
The obvious next question is about the names that look even cheaper. Some stocks in the sector fell further or pay a higher yield than anything above. Why didn't they make the list?
get_stocks, get_stock_financials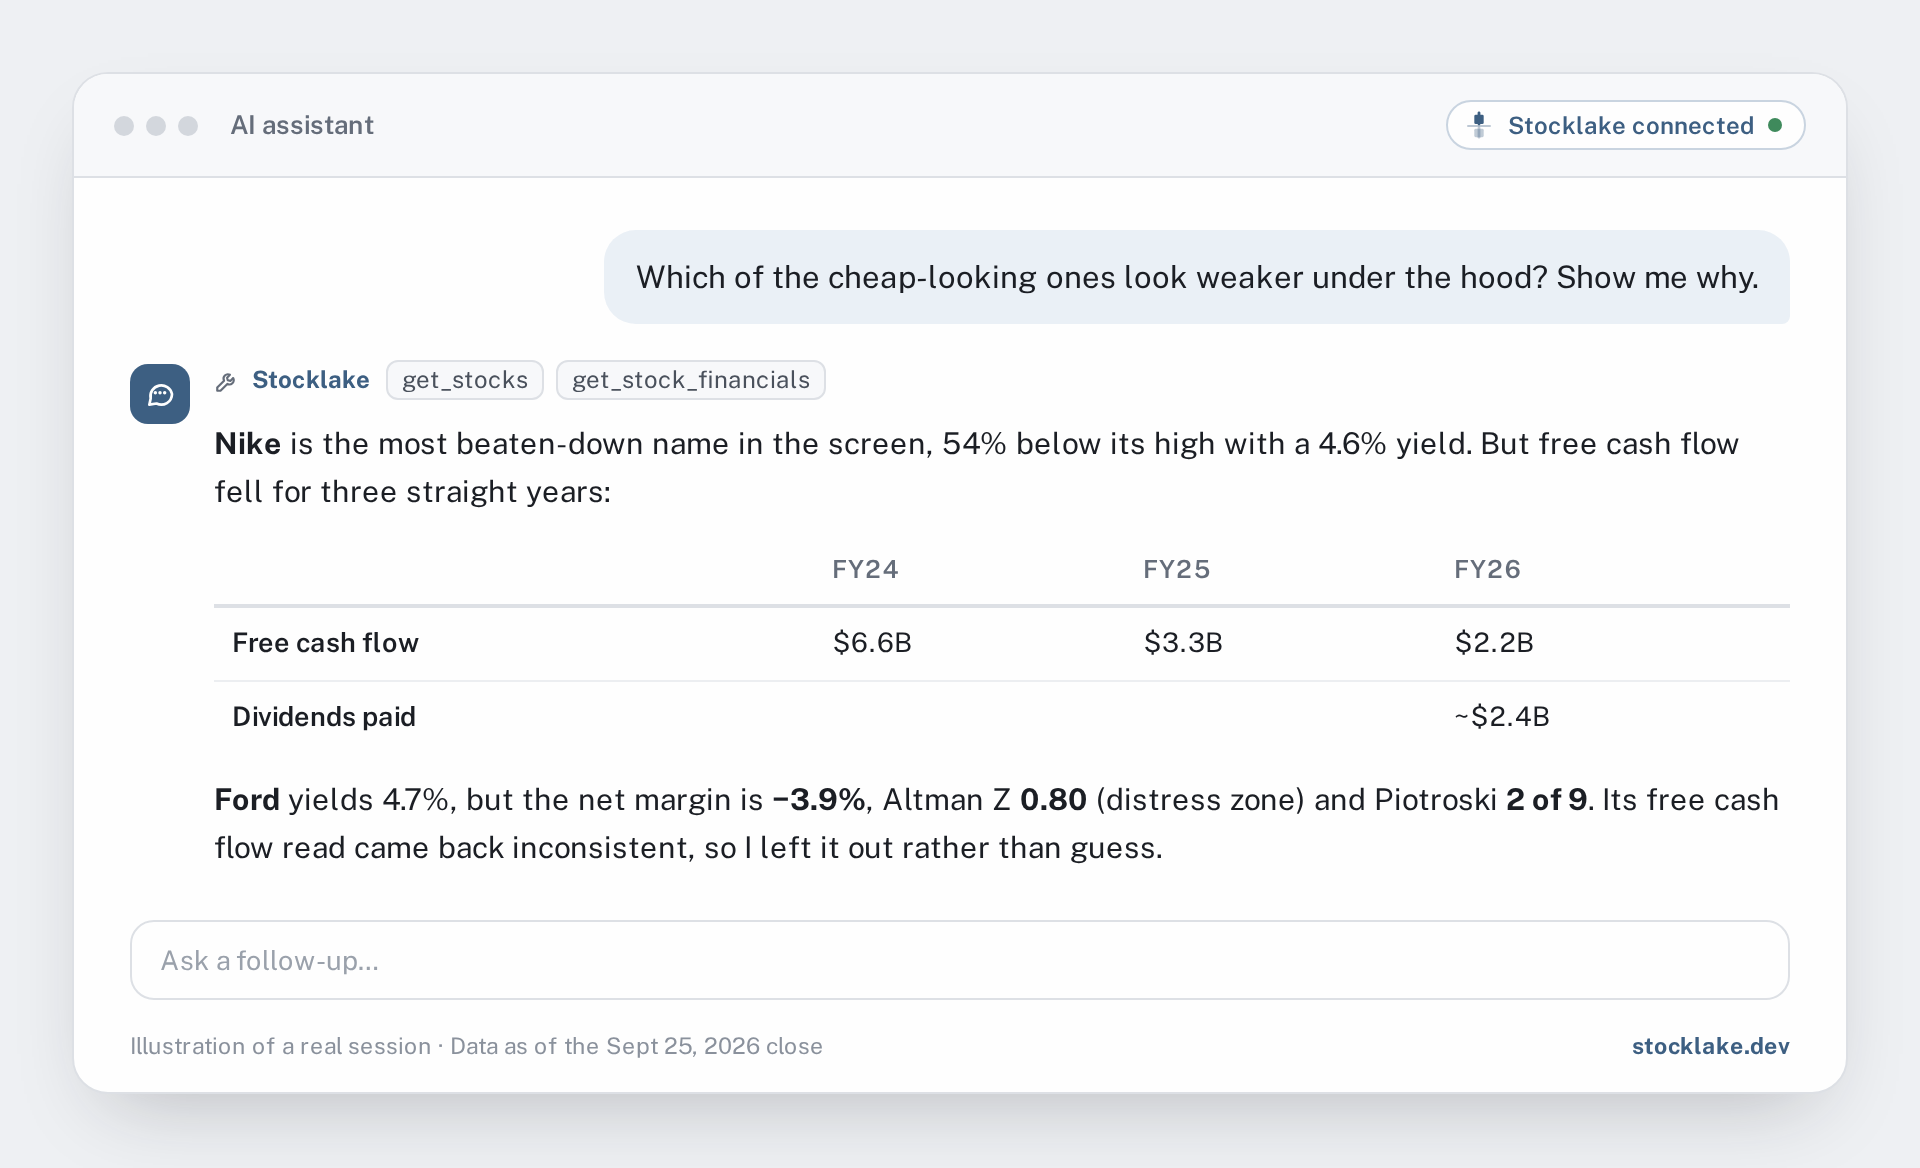
| Company | Price | Below 52w high | Debt/Equity | Op. margin (net) | Free cash flow | Rev. growth | Div. yield | Piotroski | Altman Z |
|---|---|---|---|---|---|---|---|---|---|
| NKE | $35.75 | 54% | 74% | 12.7% (6.7%) | $2.18B (FY May-26), down from $6.62B | −1.1% | 4.6% | 4 | 3.40 |
| F | $12.71 | 29% | 457% | 1.9% (−3.9%) | left out, see below | −3.8% | 4.7% | 2 | 0.80 distress |
Nike (NKE)
On price, Nike is the most beaten-down name in the whole screen, 54% below its high, with a 4.6% dividend yield. The statements tell a different story. Across the last three fiscal years, free cash flow went from $6.6 billion to $3.3 billion to $2.2 billion. The dividend costs about $2.4 billion a year, so it now exceeds the free cash flow that's supposed to pay for it. Revenue is shrinking slightly, down 1.1%, and the Piotroski score is 4. None of that says what the stock will do next. It says the high yield rests on cash flow that has been falling.
Ford (F)
Ford pairs a 4.7% yield with a low P/E, which is exactly what makes it look cheap. Underneath, the net margin is negative at −3.9%, the Altman Z of 0.80 sits in the distress zone, and the Piotroski score is 2 out of 9. The free cash flow read came back inconsistent, so it's left out here rather than guessed at. That's a good habit to keep: when two numbers that should agree don't, drop them instead of picking the convenient one.
This is the part of the workflow that pays for itself. A screen for “beaten down with a high yield” puts Nike and Ford at the top of the list. A screen that reads the statements first explains why they're not on it.
Free vs Pro for this workflow
Part of this runs on the free tier. The deeper parts need Pro.
- The screener: filter by sector, market cap and RSI
- Price, 52-week range and moving averages for each name
- 200 calls a day, and the key never expires
- Sector intelligence (the Step 1 numbers)
- The market assessment: regime, macro score, yields
- Five years of financial statements plus quarterlies
- Forensic scores: Altman Z, Piotroski F, Beneish M
Make it yours
Nothing about this is specific to consumer discretionary or to this week.
- Swap the sector. Real Estate and Utilities were tied for last on the same day. The same three prompts work on either.
- Change the thresholds. Ask for dividend payers only, and Deckers and Airbnb fall out. Ask for at least 30% below the high, and Airbnb goes too. Raise the market cap floor, or require a Piotroski score of 7 or more.
- Rerun it monthly. Sector scores move and new annual reports land. A name that was a near miss this month can pass next month, and the other way around. Asking the agent what changed since the last run is a good fourth prompt.
To try it, add Stocklake as a connector in Claude, ChatGPT or another MCP client (the connector URL is https://api.stocklake.dev/mcp). The setup steps for each client are in the docs.
One more time: these are facts, not picks
The screen results above are facts about those companies on Sept 25: their prices, their filed statements, their scores. They are not recommendations, and passing or failing a screen says nothing about where a stock goes next. A strong balance sheet doesn't stop a share price from falling further, and weak numbers can improve. Everything here is informational only, not investment advice, and not a recommendation to buy or sell any security. What you do with a list like this is your decision, and one worth making with a licensed advisor if real money is involved.
Frequently asked questions
No. Stocklake provides market data, financial statements, forensic scores and sector context to AI assistants. It doesn't generate trade calls or tell you what to buy or sell. The names in this post are the output of one screen on one day. They are facts about those companies, not recommendations.
What most people call Consumer Discretionary is labeled Consumer Cyclical in Stocklake, and Consumer Staples is Consumer Defensive. Your agent maps the everyday name to the right label on its own, but if you call the tools directly, use Stocklake's labels.
Sector intelligence is updated several times per weekday during market hours. It doesn't update overnight or on weekends, so a read on a Saturday reflects Friday's last update. Each response carries a timestamp. Financial statements change only when a company files a new period.
The free tier covers the screen itself: filtering by sector, market cap and RSI, plus price, 52-week range and moving averages for each name. Pro adds sector intelligence, the market assessment, five years of financial statements plus quarterlies, and the forensic scores (Altman Z, Piotroski F, Beneish M). Pro is $20 a month, free for 7 days, and you can cancel anytime.