Is Pfizer's 6% Dividend Covered? Comparing It With Its Peers on the Numbers
Every broker app has a “similar stocks” strip, or a “people also bought” row under the chart. Open Pfizer and you get Bristol-Myers, Merck, Gilead. What you don't get is a single fact about why any of them is on the list, or how they stack up against the one you're looking at. It's a list of names.
The question behind that strip is usually a real one: is the stock I'm looking at doing fine, and is there something in the same business that looks better on the numbers? With Stocklake connected to Claude, ChatGPT or another agent, you can ask exactly that. The agent pulls the reported statements for each company and does the arithmetic in front of you. This post walks through one real run, three prompts long, on the stock where the question is most pointed right now: Pfizer and its 6% dividend yield.
Why Pfizer
A 6% yield is the headline most people see first. The less visible fact: among four large US drugmakers, Pfizer is the only one whose free cash flow in fiscal 2025 didn't cover the dividend it paid. That's not something a “similar stocks” strip will ever show you, and it's not a field you can look up either. You have to go to the cash flow statement, take operating cash flow minus capital expenditure, and divide by dividends paid. Which is exactly the kind of thing an assistant with the statements in hand is good at.
Prompt 1: is the dividend actually covered?
get_stock · get_stock_financials · get_stock_research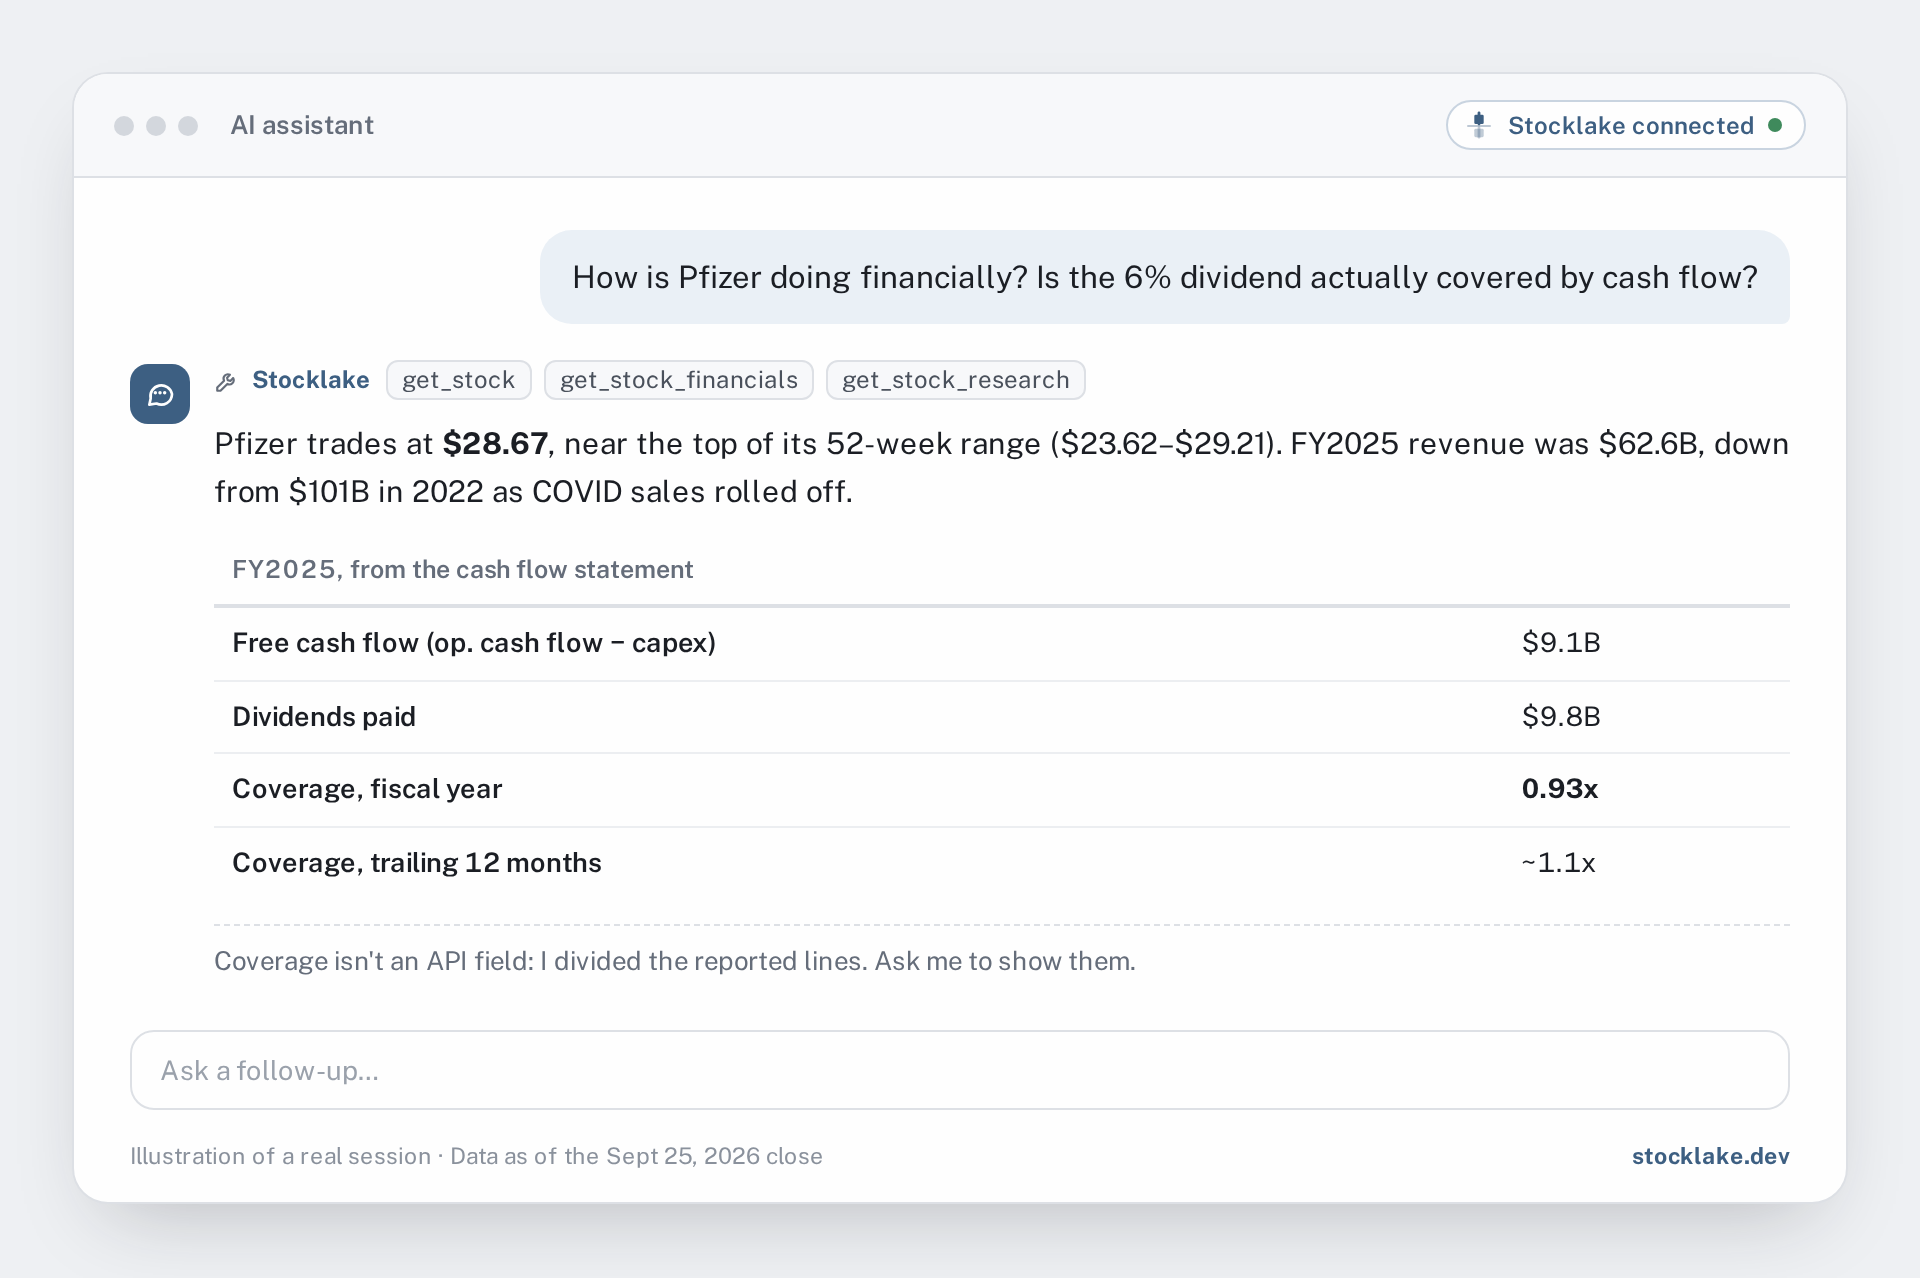
The answer, as of Sept 25: Pfizer trades at $28.67, near the top of its 52-week range of $23.62 - $29.21. FY2025 revenue was $62.6B, down 1.6% on the year and down from $101B in 2022 as COVID product sales rolled off. Free cash flow was $9.1B, or 14.5% of revenue. Dividends paid were $9.8B. That's coverage of 0.93x for the fiscal year. On a trailing-twelve-month basis it's a little better at about 1.1x.
None of those coverage figures is a field the MCP server returns. Stocklake returns the raw statement lines, and the agent did the division. That matters for two reasons. First, it means the question can be asked in whatever form you care about: FCF against dividends, dividends plus buybacks, a five-year average. Second, it means you can see the working. Ask your agent to show which lines it used and to lay out the arithmetic, then check it. That's the whole deal: raw statements in, arithmetic out.
Prompt 2: put it next to its peers
get_stocks · get_stock_financials for each of the four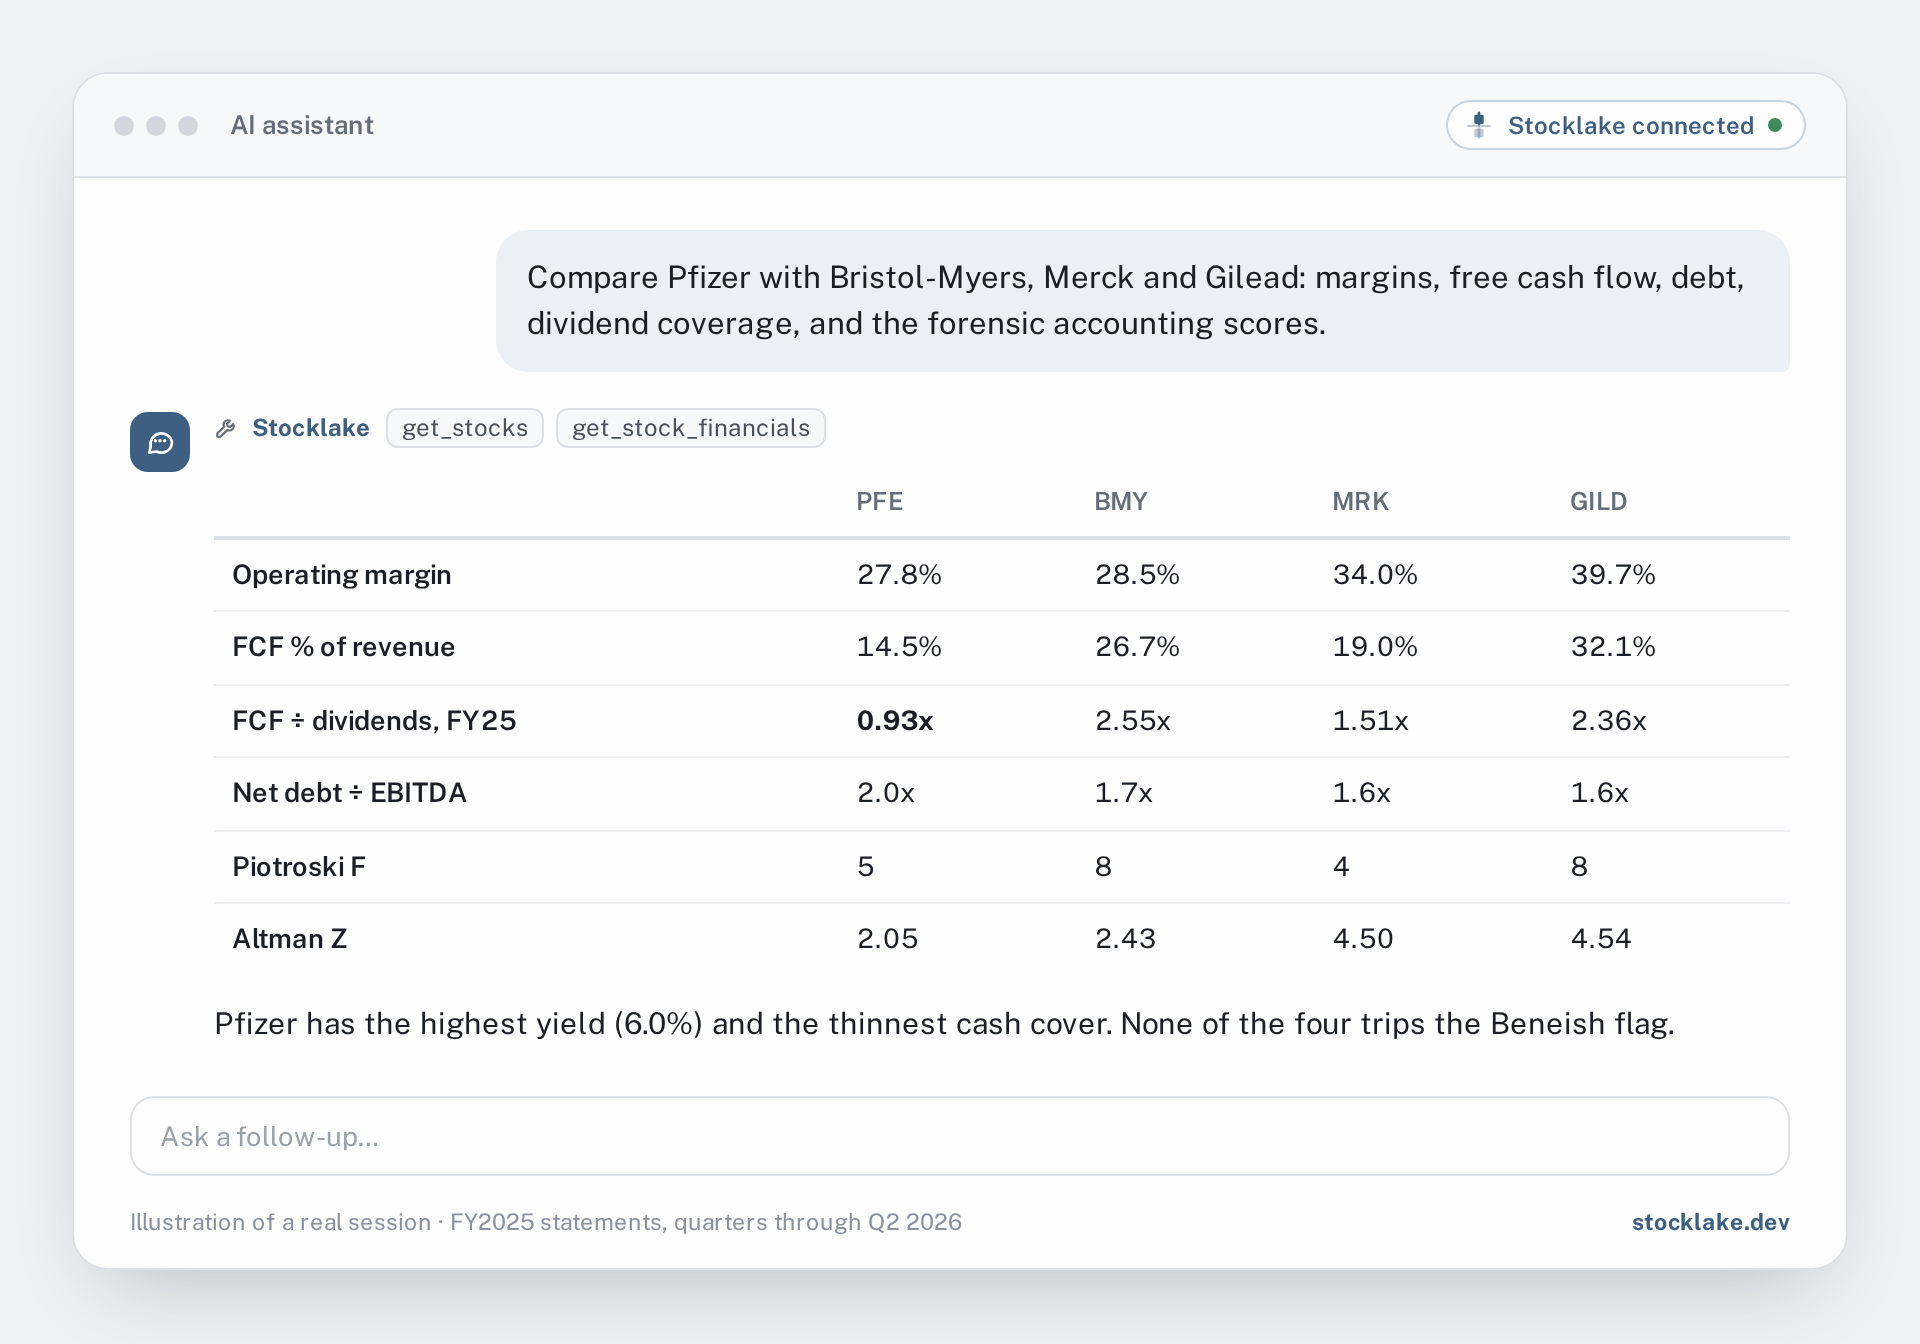
Here's the condensed version of what came back. Fiscal-year figures are FY2025; net debt and trailing figures run through Q2 2026.
| As of Sept 25, 2026 | PFE | BMY | MRK | GILD |
|---|---|---|---|---|
| Price (52-week range) | $28.67 (23.62-29.21) | $62.86 (42.52-68.64) | $148.78 (78.03-156.92) | $150.93 (108.46-157.29) |
| FY25 revenue (YoY) | $62.6B (−1.6%) | $48.2B (−0.2%) | $65.0B (+1.3%) | $29.4B (+2.4%) |
| Revenue 2022 → 2025 | $101B → $62.6B | flat, $46-48B | $59.3B → $65.0B | $27.3B → $29.4B |
| Operating margin | 27.8% | 28.5% | 34.0% | 39.7% |
| FCF (% of revenue) | $9.1B (14.5%) | $12.8B (26.7%) | $12.4B (19.0%) | $9.5B (32.1%) |
| FCF ÷ dividends, FY25 | 0.93x | 2.55x | 1.51x | 2.36x |
| FCF ÷ dividends, TTM | 1.12x | 2.25x | 1.94x | 3.18x |
| Net debt ÷ EBITDA | 2.0x | 1.7x | 1.6x | 1.6x |
| Interest coverage | 6.5x | 7.3x | 16.3x | 11.4x |
| Dividend yield | 6.0% | 4.0% | 2.3% | 2.2% |
| P/E trailing / forward | 37.7 / 9.9 | 13.8 / 9.6 | 119* / 15.6 | 18.4* / 15.3 |
| Piotroski F (0-9) | 5 | 8 | 4 | 8 |
| Altman Z | 2.05 (grey) | 2.43 (grey) | 4.50 (safe) | 4.54 (safe) |
A few things stand out once the numbers sit next to each other:
- Coverage. Pfizer paid about $9.8B in dividends against $9.1B of free cash flow in FY2025. The other three covered theirs between roughly 1.5x and 2.6x, and between about 1.9x and 3.2x on a trailing basis. Pfizer has the highest yield of the four and the thinnest cash cover for it.
- Bristol-Myers is the interesting comparison. Its forward P/E (9.6) is almost the same as Pfizer's (9.9). But it turns 26.7% of revenue into free cash flow against Pfizer's 14.5%, roughly twice the conversion, and it covered its dividend 2.55x. Its revenue has been flat rather than shrinking.
- The forensic scores split the group. Bristol-Myers and Gilead both score 8 out of 9 on Piotroski F; Pfizer scores 5 and Merck 4. On Altman Z, Merck and Gilead sit in the safe zone, Pfizer and Bristol-Myers in the grey zone. None of the four trips the Beneish M-Score flag. These are screening formulas with known blind spots, not verdicts; we wrote up how they work and where they mislead separately.
- Pfizer's high trailing P/E is a shrinking-earnings story. A trailing P/E of 37.7 next to a forward P/E of 9.9 says earnings fell hard as COVID revenue rolled off, and that the forward estimate prices in a recovery. Whether that recovery shows up is the open question the numbers can't answer for you.
- Debt is manageable across the board. Net debt runs from $23.1B (Gilead) to $51.5B (Pfizer) as of Q2 2026, and every company sits between 1.6x and 2.0x EBITDA. Pfizer carries the most, with the thinnest interest coverage at 6.5x.
Prompt 3: check the recent quarters
Two numbers in that table look strange: Merck at a 119 trailing P/E and Gilead at 18.4 despite healthy margins. Before comparing anything on trailing earnings, it's worth asking whether something unusual happened recently.
get_stock_financials (quarterly) for each of the four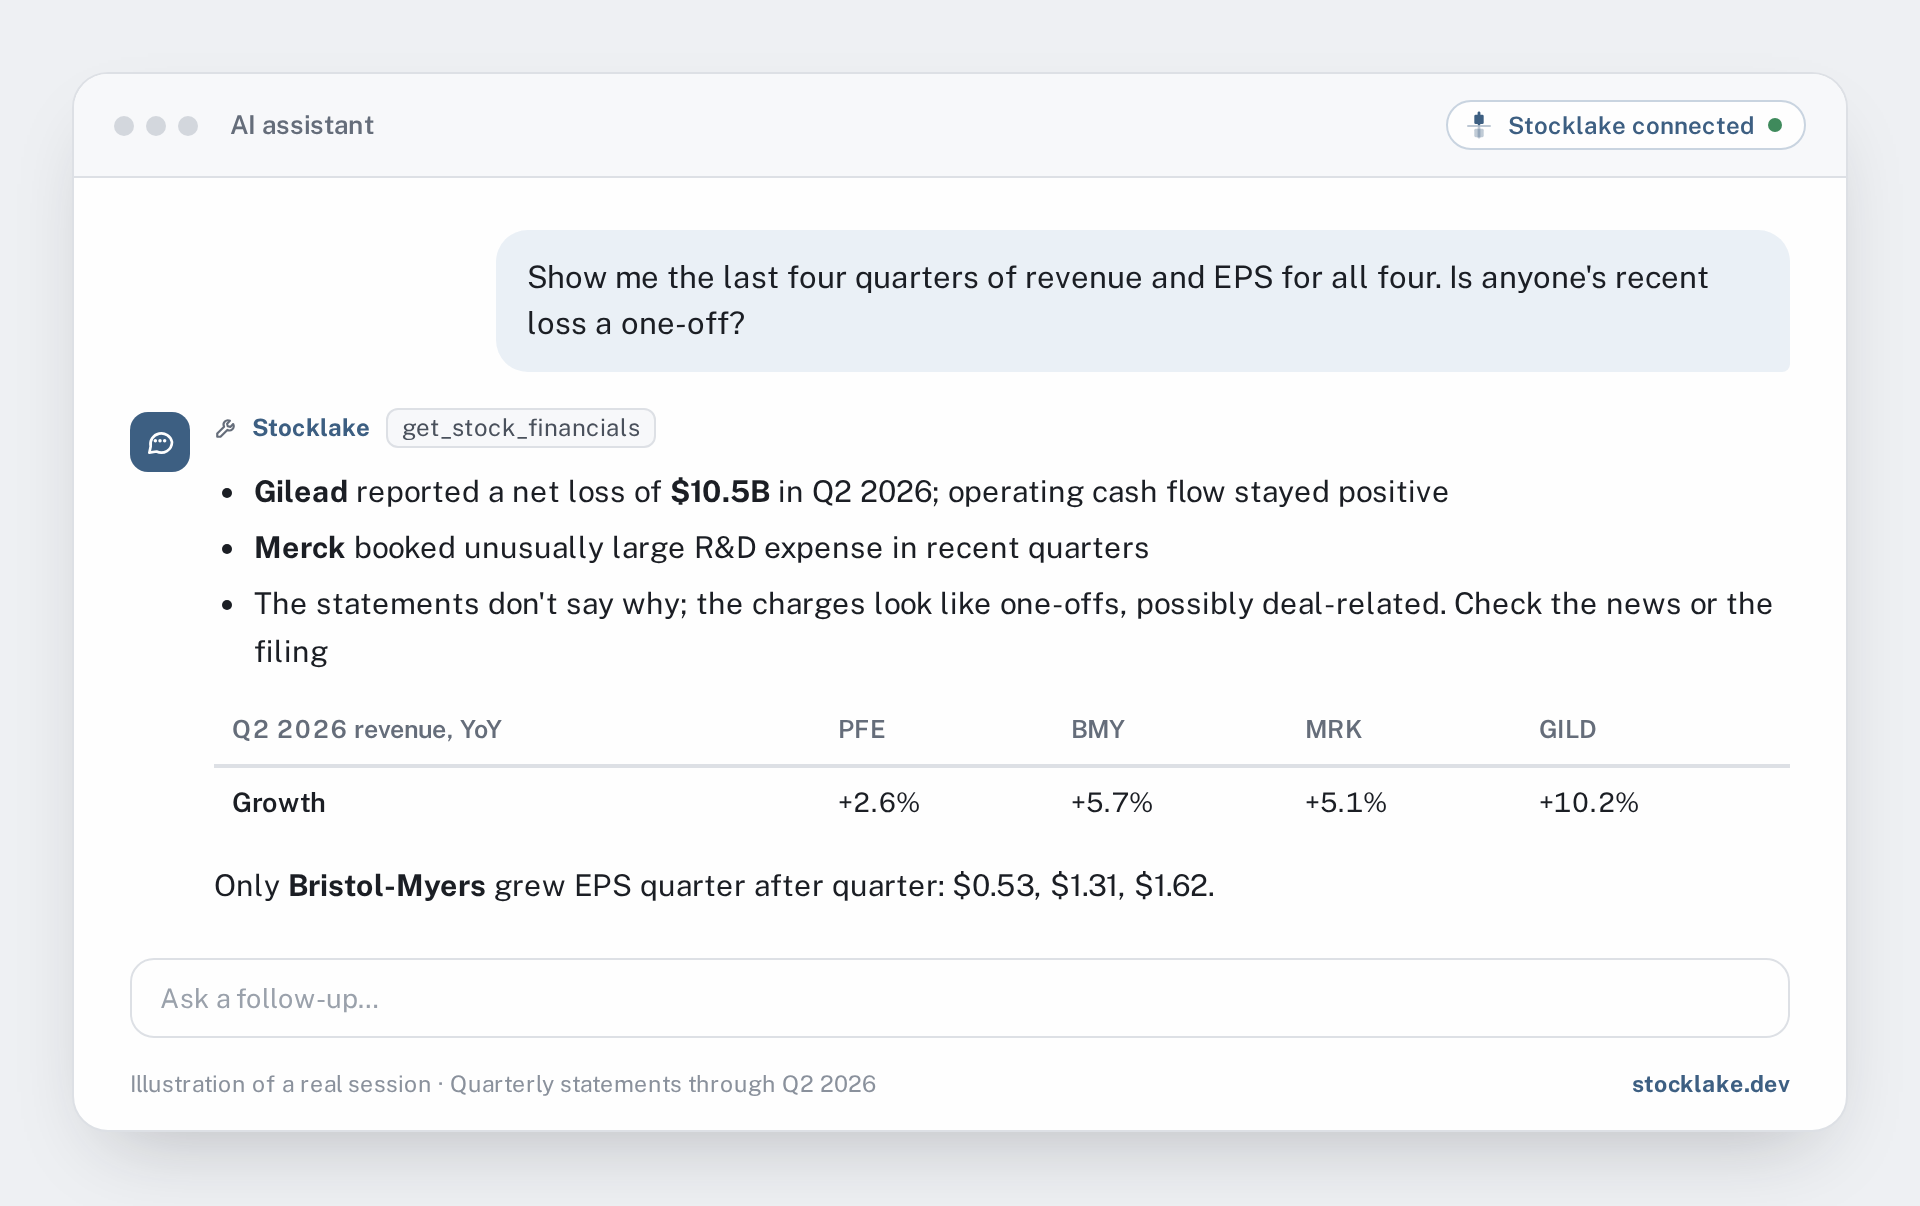
The quarterly statements explain the outliers. Merck reported unusually large R&D expense in recent quarters, and Gilead reported a net loss of $10.5B in Q2 2026. In both cases operating cash flow stayed positive, which is why their free cash flow and coverage numbers still look healthy while trailing earnings don't. The charges look like one-offs, possibly tied to deals, but the statements themselves don't tell you the cause. If it matters to your read, ask the assistant to pull the news for that quarter, or go to the filing.
The same prompt surfaces two more things worth knowing. Revenue grew year over year in Q2 2026 for all four: Pfizer +2.6%, Merck +5.1%, Bristol-Myers +5.7% and Gilead +10.2%. And Bristol-Myers was the only one of the four with EPS rising quarter after quarter: $0.53, then $1.31, then $1.62. Next earnings dates, as of Sept 25: Bristol-Myers and Merck on October 29, Pfizer on November 3; Gilead hadn't published a date yet.
To be fair to Pfizer
A comparison like this can make one company look bad without meaning to. So it's worth asking the assistant for the other side, too. On Pfizer, that side has real substance. In August, Pfizer's CEO and two directors each bought about $1M of Pfizer stock, $2.96M in total, with no open-market sales by them. Stocklake's AI summary for Pfizer reads neutral, with an ai_score of 67. The trailing twelve months already show coverage back above 1.0x. And a dividend that runs slightly ahead of free cash flow for one year can be paid from the balance sheet; whether that continues depends on the earnings recovery the forward P/E is pricing in.
One tip when you ask about insiders: have your agent cite the actual transaction rows, with names, dates and amounts. The one-line summary of insider activity can lag the latest filings, and the rows are what you want to check.
What the numbers show is narrower than a verdict. Pfizer is the highest-yielding of the four and the one with the least cash cover for that yield in FY2025. Bristol-Myers trades at nearly the same forward multiple with about twice the cash conversion. Gilead and Merck carry the cleanest forensic readings but trade at higher forward multiples and lower yields. Which of those trade-offs matters is your call.
Try it on your own holding
The three prompts above work for any company where you have a rough sense of who its competitors are. A reusable template:
If you're not sure who the peers are, ask the agent to find them first: “Which companies in the same industry are closest to <your stock> by market cap?” It'll run the screener, and you can edit the list before the comparison starts.
Free vs Pro for this question
Frequently asked questions
Either you name them, as in this post, or you ask the agent to find them. Stocklake's screener can filter by sector, industry and market cap, so a prompt like “find the three largest US drugmakers closest to Pfizer by market cap” turns into a screener call. It's worth reading the list before you run the comparison: a peer set is a judgment call, and the answer is only as useful as the companies you put next to each other.
No. Stocklake returns the reported statement lines: operating cash flow, capital expenditure, dividends paid, cash, debt, operating income and so on. Free cash flow, FCF-to-dividend coverage, net debt and net debt to EBITDA in this post were computed from those raw lines. That is the point of the workflow, and it's also why you should ask the assistant to show its arithmetic and check it.
No. It is a side-by-side of reported facts as of September 25, 2026. Stocklake doesn't generate trade calls, and nothing here says which of the four companies to own. A dividend that isn't fully covered in one year can still be sustained from the balance sheet, and a cheaper-looking multiple can be cheap for good reasons. What you do with the comparison is your own decision.
The free tier covers price, valuation multiples, dividend yield, the 52-week range, analyst consensus, earnings dates, plain headlines and the screener for finding peers. Five years of statements plus quarterlies, the forensic scores (Altman Z, Piotroski F, Beneish M), the AI summary and sentiment, and the full insider transaction list are Pro. Pro is $20 a month with a 7-day free trial.
Everything above is a comparison of reported facts as of September 25, 2026, and it will be out of date by the time the next quarter is filed. It is informational only: not investment advice, and not a recommendation to buy or sell Pfizer, Bristol-Myers Squibb, Merck, Gilead or any other security.