Run a Red-Flag Scan on Your Holdings: Altman, Piotroski and Beneish in One Chat
Most people check their holdings by price: what's up, what's down, what moved today. The balance sheet underneath rarely gets a look, because reading ten annual reports takes a weekend. Three well-known accounting models compress that reading into one number each. Stocklake computes all three from each company's own filed statements and returns them inside get_stock and get_stocks for Pro keys.
Below: what the three scores mean, a real scan of a ten-stock portfolio, a closer look at the one holding that tripped a flag, and which holdings got stronger or weaker over the past year. I ran these on September 27 with an AI agent (Claude, ChatGPT or another MCP client works the same way); prices are the Friday, September 25 close, and the scores come from each company's latest fiscal-year filing.
The three scores in plain English
Blends working capital, retained earnings, operating profit, market value and sales, each against the size of the company. It was built to spot manufacturers heading toward bankruptcy.
Nine yes/no tests comparing this year with last: is it profitable, is cash flow positive and above earnings, did debt, liquidity, margins and asset turnover improve, were no new shares issued.
Eight ratios that look for patterns seen in companies later caught manipulating earnings: receivables outgrowing sales, slipping margins, a rising share of hard-to-value assets, accruals running ahead of cash.
Two limits apply to any result. Banks and insurers mostly return no score, because none of the models describes a lender's balance sheet. And each model mistakes some normal businesses for problems: a big acquisition, a large capital raise, a severe margin swing or very fast early growth can trip Beneish, and REITs and payment companies holding customer money can land low on Altman for structural reasons.
1. Scan the whole portfolio
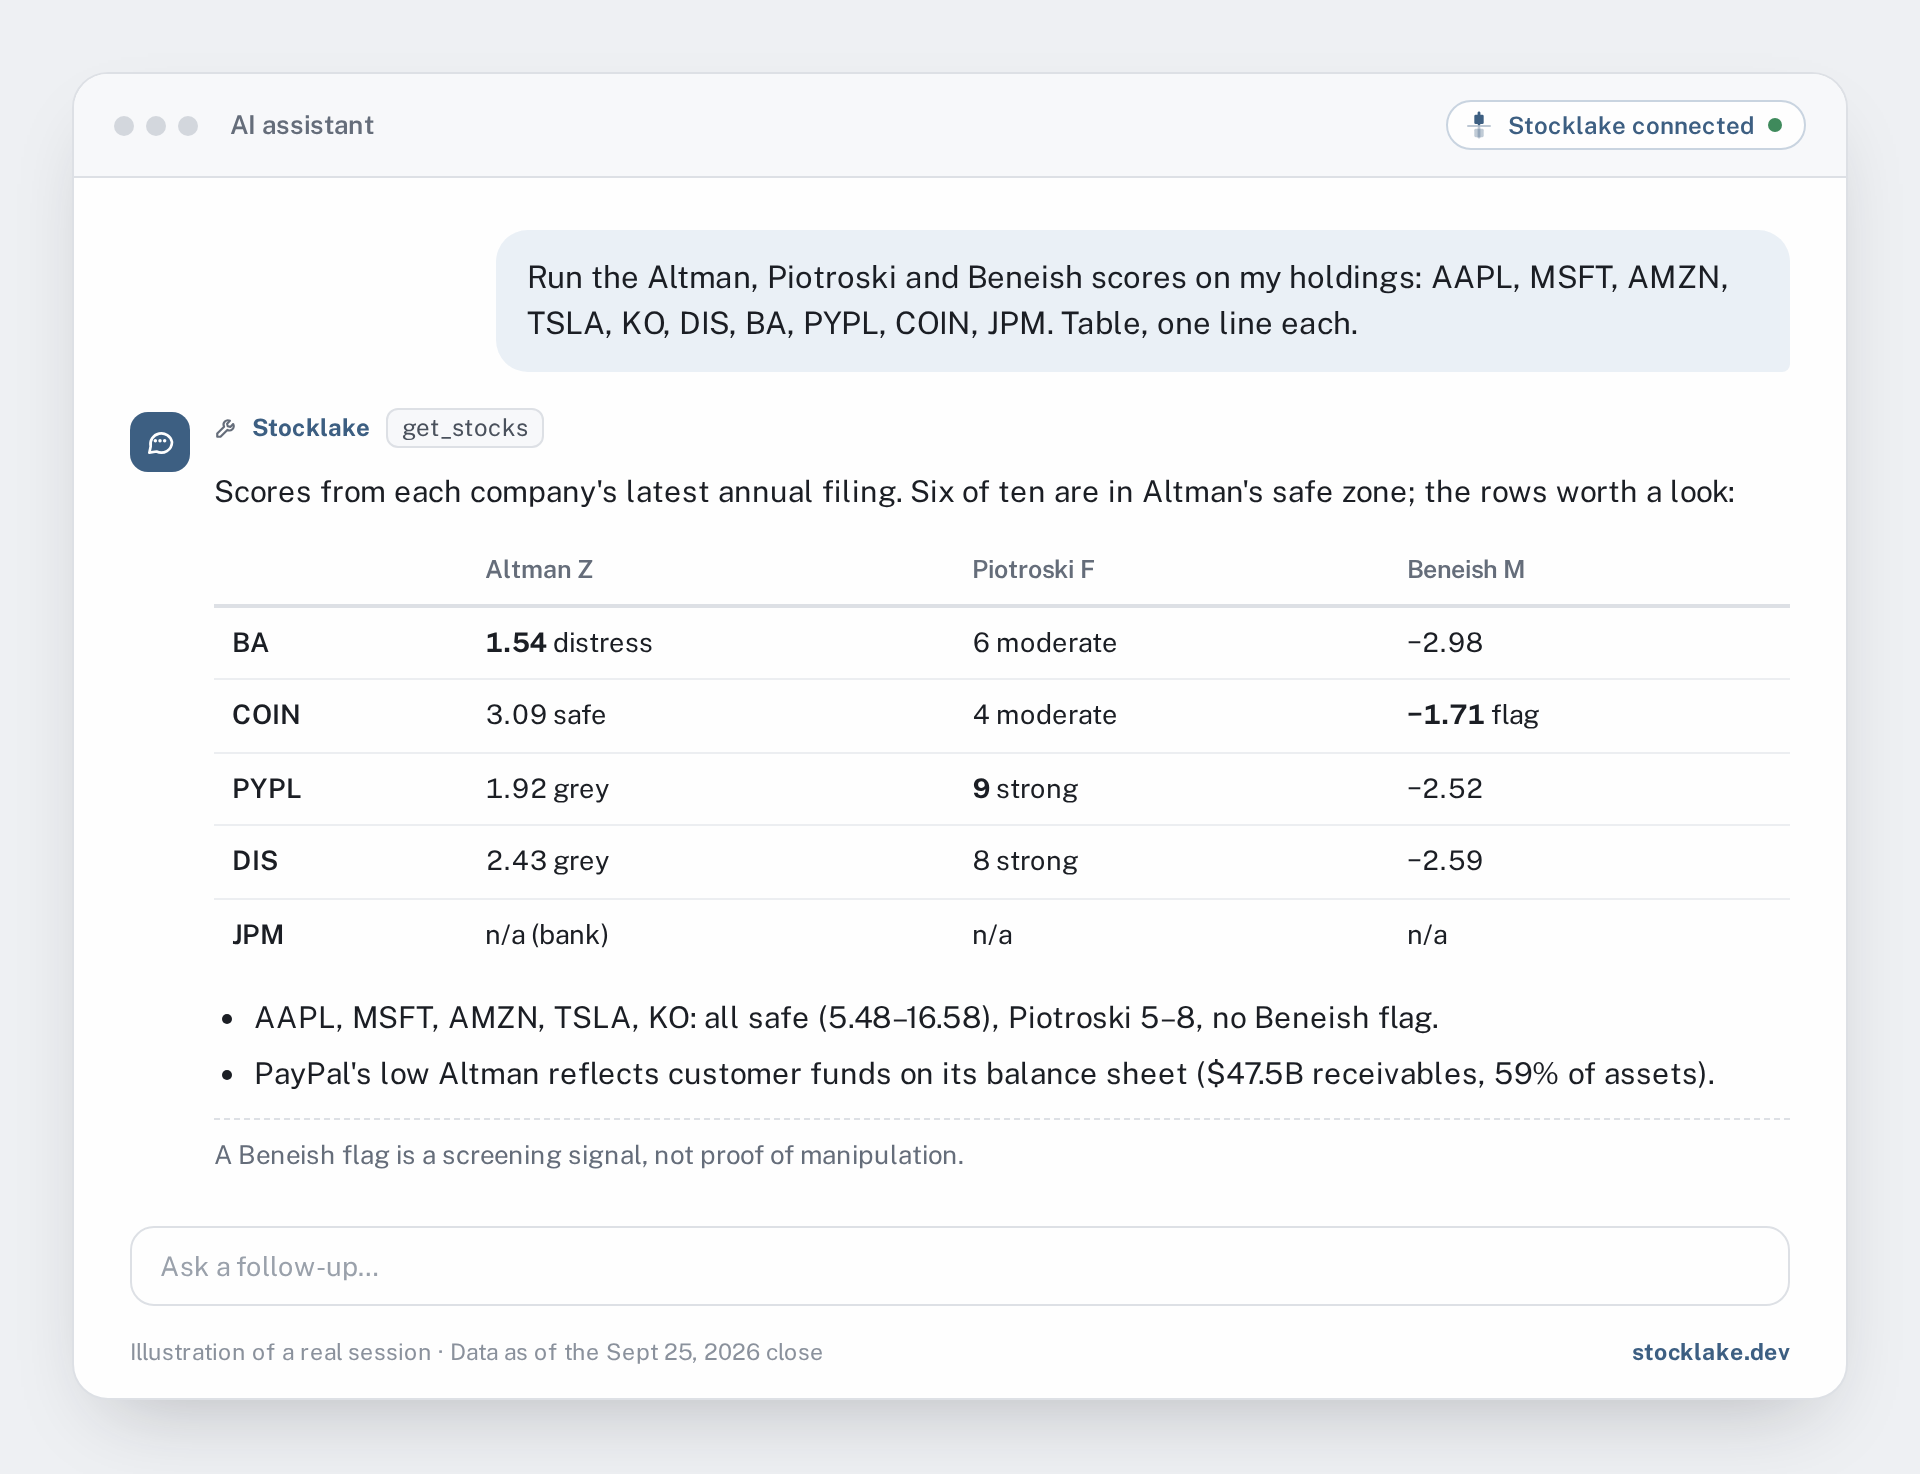
A sample portfolio of ten widely held names. One get_stocks call covers all ten.
What came back (as of Sept 25)
| Holding | Price | Altman Z | Piotroski F | Beneish M |
|---|---|---|---|---|
| AAPL | $341.07 | 12.07 safe | 8 strong | −2.37 |
| MSFT | $516.17 | 9.08 safe | 6 moderate | −2.63 |
| AMZN | $249.67 | 5.96 safe | 6 moderate | −2.59 |
| TSLA | $372.11 | 16.58 safe | 5 moderate | −2.88 |
| KO | $87.81 | 5.48 safe | 7 moderate | −2.35 |
| DIS | $106.15 | 2.43 grey | 8 strong | −2.59 |
| BA | $198.07 | 1.54 distress | 6 moderate | −2.98 |
| PYPL | $55.04 | 1.92 grey | 9 strong | −2.52 |
| COIN | $195.11 | 3.09 safe | 4 moderate | −1.71 flag |
| JPM | $343.06 | n/a | n/a | n/a |
- Six of ten are in Altman's safe zone, from Coca-Cola at 5.48 to Tesla at 16.58. Disney (2.43) and PayPal (1.92) sit in the grey zone, and Boeing (1.54) is the only one in the distress zone. The fiscal 2025 statements show why: liabilities of $162.8B against total assets of $168.2B, about 97%, with operating profit (EBIT) of $5.4B, about 3% of assets.
- Three holdings score strong on Piotroski: PayPal with a full 9, Apple and Disney with 8. Coinbase is lowest at 4. Nobody is in the weak band.
- One Beneish flag: Coinbase at −1.71, just above the −1.78 line. Every other scored holding is at −2.35 or lower.
- Two readings need context, not alarm. PayPal reports $47.5B of receivables, 59% of its $80.2B in total assets; for a payments company that line largely reflects customer funds in transit, the documented case where Altman reads low by construction. The same company scores 9 of 9 on Piotroski. JPMorgan is out of scope for all three models, and the score block says so in a note rather than showing a number.
- One row per holding, with the zone or band written out next to each number, not just the raw score.
- Missing scores shown as missing, with the reason (JPMorgan is a bank), never filled in with a guess.
- It says which fiscal year the scores come from, so you know how old the underlying filing is.
2. Why did Coinbase trip the Beneish screen?
A flag on its own tells you nothing about why. Stocklake's MCP tools return the M-Score and the flag, not the eight component ratios, so this is a question the assistant answers by pulling the raw statements with get_stock_financials and doing the arithmetic itself.
What came back (fiscal 2025 vs fiscal 2024)
- It reproduced the score first: recomputed from the statements, the M-Score came out at −1.71, matching the score the MCP server returns.
- Receivables were the biggest driver. Receivables rose from $915M to $1.73B, up 89%, while revenue rose 9.4%, from $6.56B to $7.18B. Receivables went from 13.9% of revenue to 24.0%, so the receivables index (DSRI) is 1.72. Weighted, that one ratio puts about 0.67 more on the score than a neutral reading of 1.0 would.
- Asset mix was the second. The share of total assets that is neither current assets nor property and equipment went from 18.4% to 29.9%, an asset-quality index (AQI) of 1.63, worth about 0.25 over neutral. Non-current assets more than doubled, from $4.43B to $9.28B, and the gap between shareholders' equity and tangible book value grew from $1.19B to $5.57B. That's the pattern goodwill and intangibles from an acquisition leave behind.
- Two ratios pulled the other way. Operating cash flow of $2.43B was almost double net income of $1.26B, so accruals (TATA) lowered the score. Leverage also fell slightly, with liabilities going from 54.4% to 50.1% of assets, even though the company issued $3.58B of debt during the year.
- The sensitivity check: if receivables had grown in line with revenue, the score would be about −2.38, well below the line. The flag rests on one balance-sheet line and an asset-mix shift.
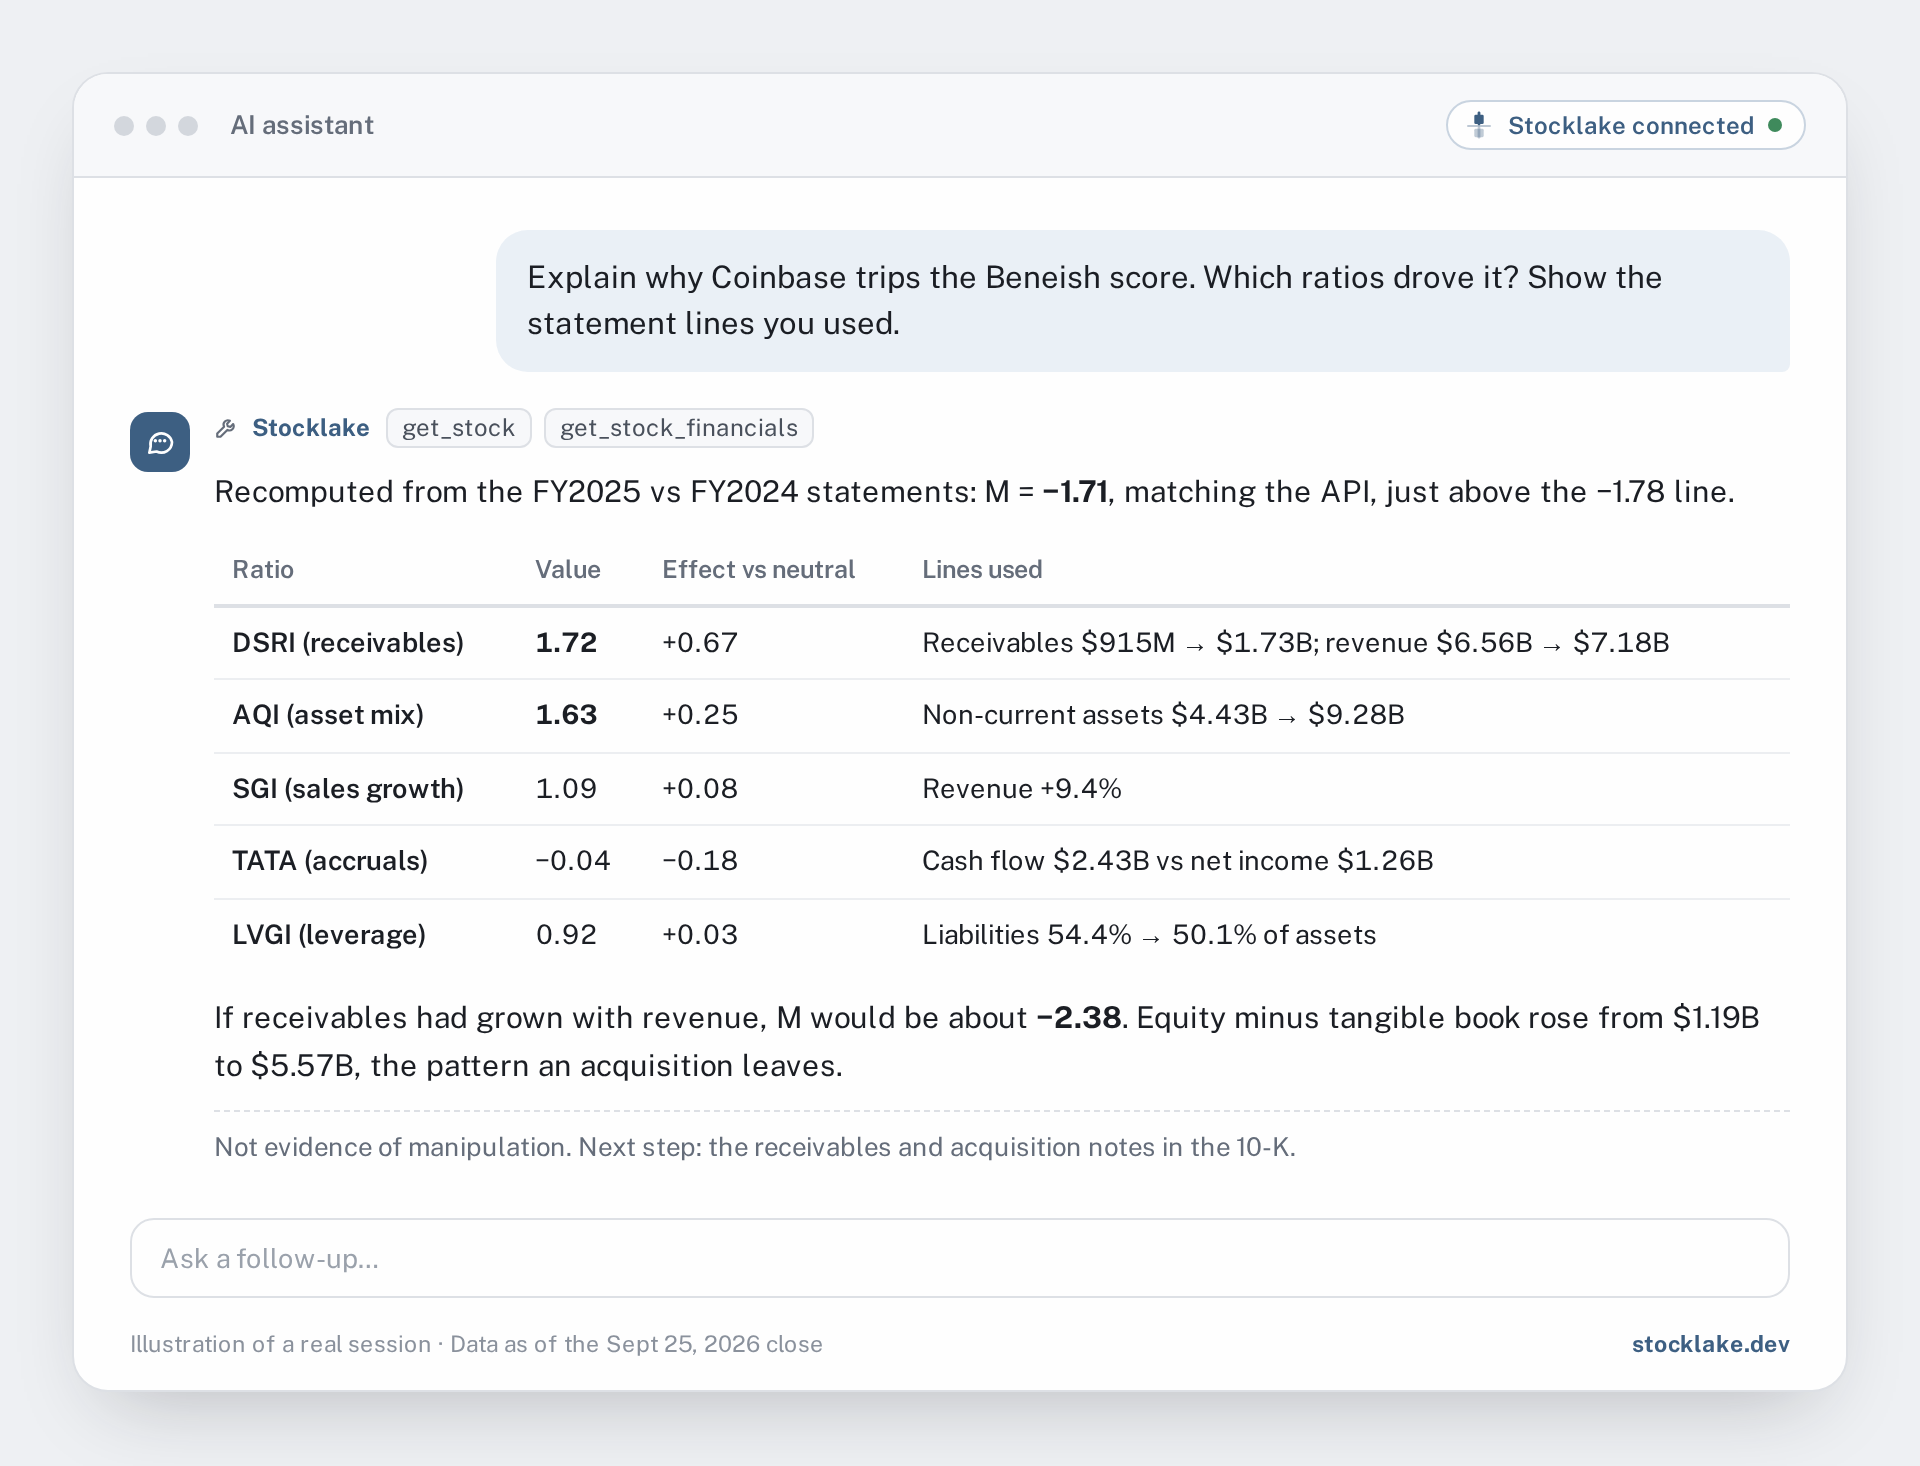
None of this says anything is wrong at Coinbase. Receivables can grow for ordinary business reasons, and an acquisition moves asset quality mechanically. What the breakdown gives you is a short reading list: the receivables and acquisition notes in the annual report. One timing detail: the scores use fiscal 2025, while Coinbase's trailing-twelve-month profit margin is −16.3%, so recent quarters look different from the filing the scores are built on.
- It states plainly that a Beneish flag is a screening signal, not evidence of manipulation.
- It recomputes the score from the statements and checks that it matches before explaining it.
- It ranks the eight ratios by how much each moved the score, with the underlying line items and both years' values.
3. Who got stronger or weaker since last year?
A single Piotroski score is a snapshot; for a portfolio, direction matters more. The MCP tools return this year's score. Last year's the assistant rebuilds from three fiscal years of statements via get_stock_financials, using the same nine tests.
What came back (latest fiscal year vs the one before)
| Holding | Last year | This year | What changed |
|---|---|---|---|
| BA | 2 | 6 | Back to profit and positive cash flow; margin and asset turnover up |
| KO | 4 | 7 | Return on assets, debt share and current ratio all improved |
| AAPL | 6 | 8 | Gained three tests; lost cash-over-earnings ($111.48B cash flow vs $112.01B net income) |
| PYPL | 7 | 9 | Debt share and current ratio, both on very small moves |
| MSFT | 5 | 6 | Gained return on assets and no-new-shares; lost current ratio |
| TSLA | 4 | 5 | Gross margin 17.86% to 18.03% |
| DIS | 8 | 8 | No test changed |
| AMZN | 7 | 6 | Current ratio 1.064 to 1.051 |
| COIN | 8 | 4 | Return on assets, turnover, debt share and gross margin all slipped |
- It checked itself first: its rebuilt current-year scores matched the returned scores for all nine holdings before it compared anything.
- Biggest improvement, Boeing (2 to 6): net income went from −$11.82B in 2024 to $2.24B in 2025, operating cash flow from −$12.08B to $1.07B, and gross margin from −3.0% to 4.8%. That doesn't contradict its Altman distress reading: the income statement recovered, the balance sheet is still heavy with liabilities.
- Coca-Cola (4 to 7): return on assets rose from 10.6% to 12.5%, long-term debt fell from 42.1% to 40.2% of assets, and the current ratio went from 1.03 to 1.46.
- Biggest decline, Coinbase (8 to 4): return on assets fell from 11.4% to 4.3% and asset turnover from 0.29 to 0.24, while long-term debt rose from 18.8% to 20.0% of assets. The gross-margin test failed on a drop of 0.14 points, from 74.78% to 74.64%.
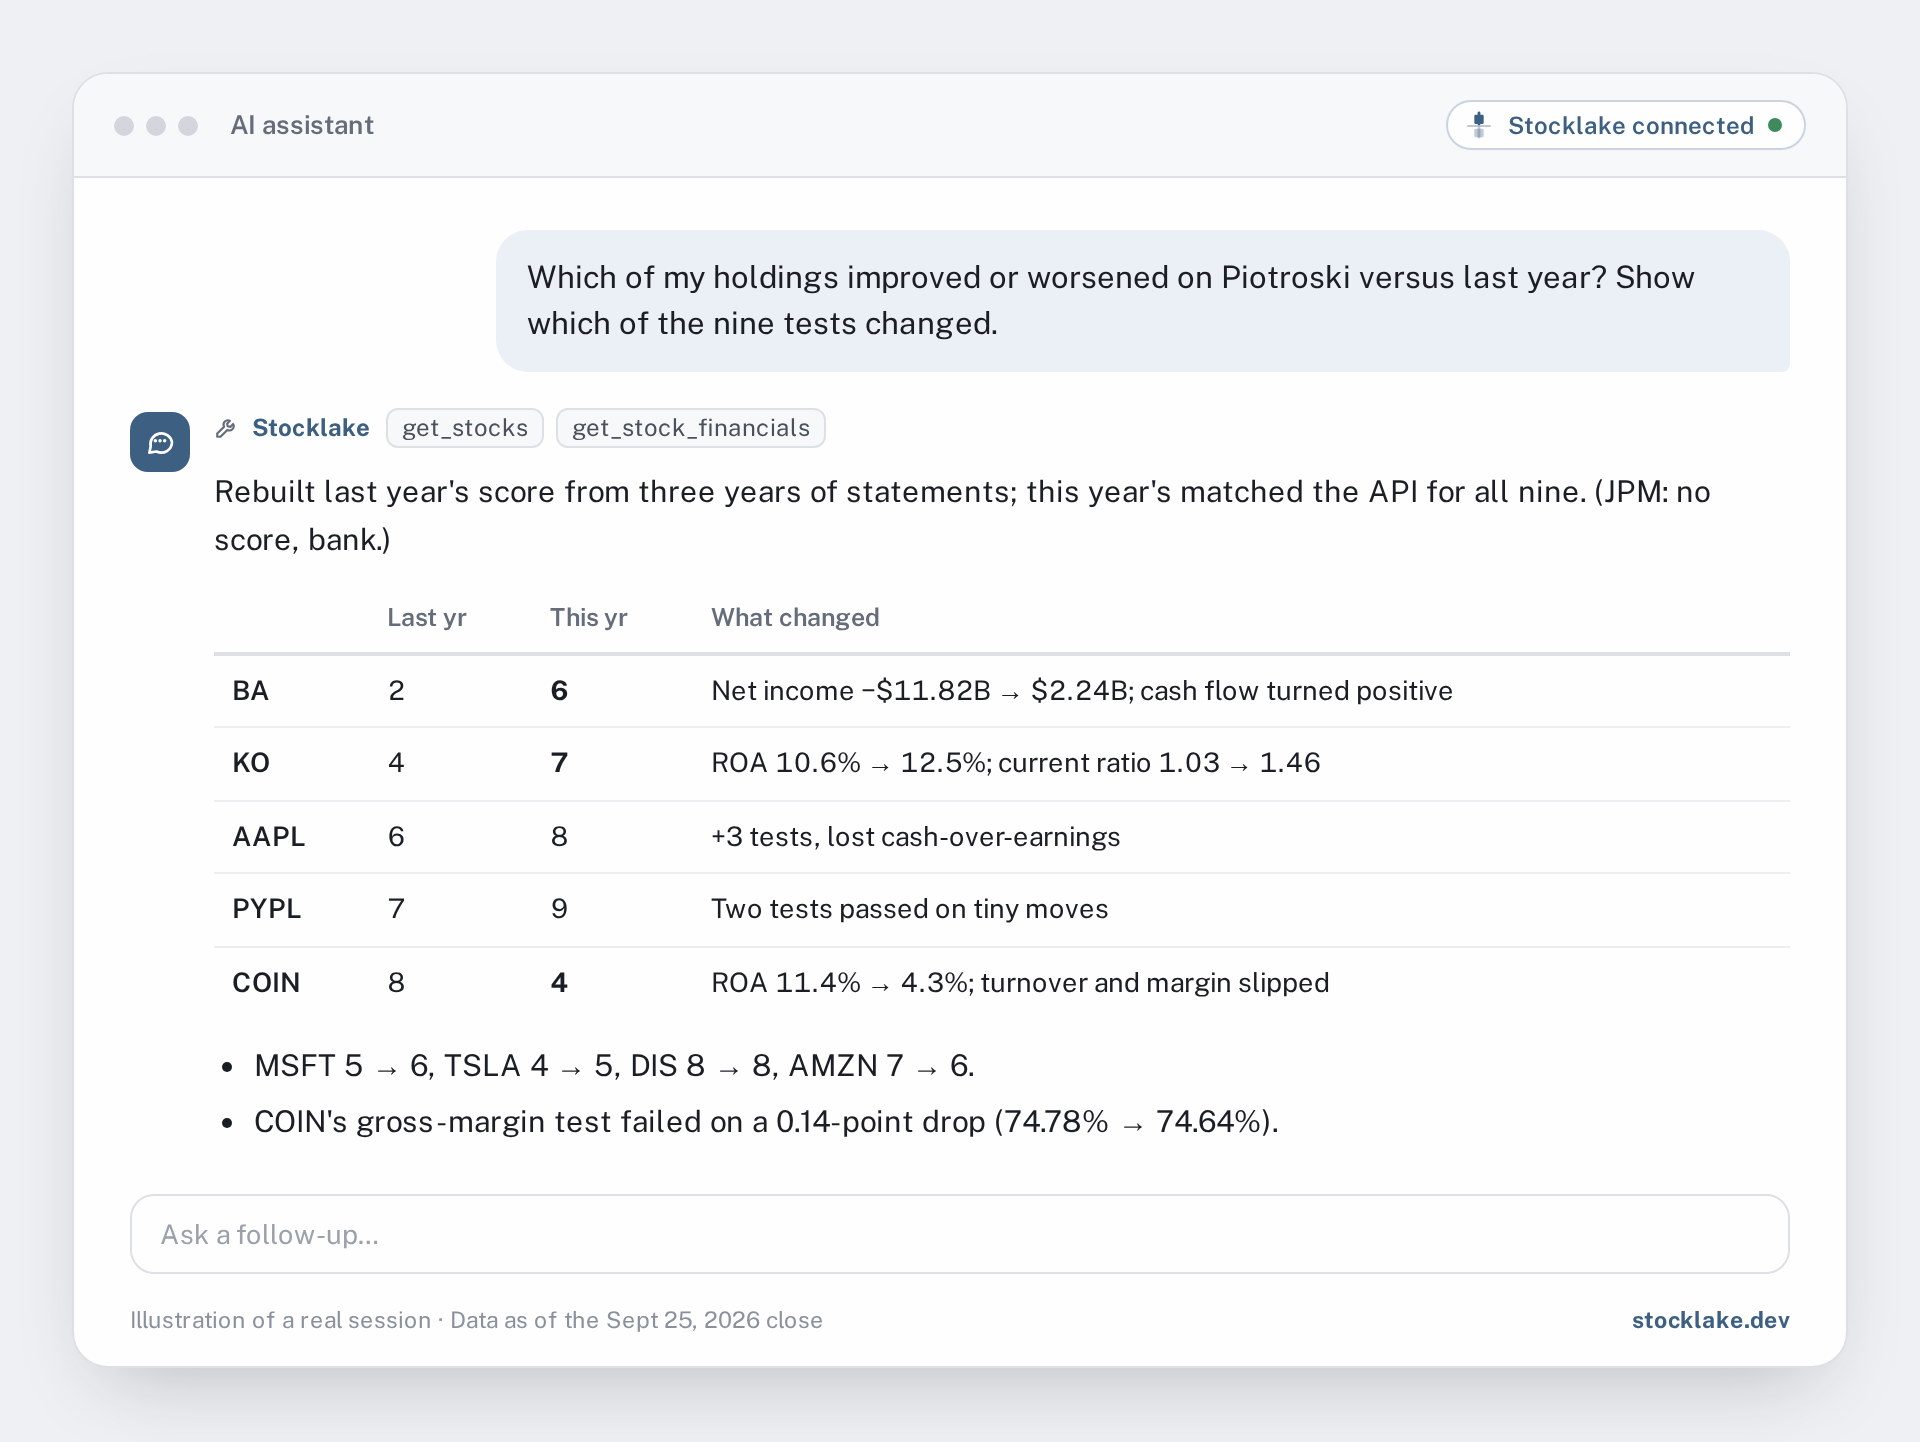
Some of these moves are tiny. PayPal's two new points came from long-term debt edging from 12.55% to 12.46% of assets and the current ratio from 1.280 to 1.287. The tests are pass/fail, so a hair's-width change counts as a full point.
- It rebuilds last year's score with the same nine tests and confirms this year's matches the score the MCP server returns before comparing.
- It names which of the nine tests flipped, with both years' numbers, rather than just the net change.
- It flags when a point was won or lost on a very small move.
Free vs Pro for this question
The scores are a Pro field inside get_stock and get_stocks. The free tier still answers useful first questions about the same holdings.
- Price, 52-week range, market cap
- Headline fundamentals: margins, debt-to-equity, free cash flow
- RSI and moving averages
- Analyst consensus and the next earnings date
- Batch lookups for up to 25 holdings at once
- Forensic scores (Altman Z, Piotroski F, Beneish M)
- Five years of statements plus quarterlies
- AI summary and news sentiment
- The full insider transaction list
- Technical rating and the full indicator breakdown
Tips for better answers
- Ask the assistant to cite the statement lines it used. “Show the line items and both years' values” turns a claim into something you can check against the filing in a minute.
- Ask it to recompute before it explains. If its arithmetic doesn't land on the published score, it's reading different inputs. And treat zone lines as fuzzy: −1.71 and −1.85 are closer than the flag makes them look.
Setting it up
Stocklake works in Claude, ChatGPT and other MCP clients. Add it once as a connector, using the server URL https://api.stocklake.dev/mcp. It's then available in every chat. You can start on the free tier without a card and add Pro when you want the scores and the multi-year statements. Setup steps for each client are in the docs, and the scoring details, including every documented limitation, are in the forensic scores post.
Frequently asked questions
No. The Beneish M-Score is a 1999 statistical screen. A reading above −1.78 means the company's year-over-year ratio profile looks like the profiles in Beneish's sample of companies later caught manipulating. Large acquisitions, big capital raises, sharp margin swings and very fast growth can all produce the same profile. It's a prompt to read the filings, not a finding.
Banks and insurers mostly return no Altman, Piotroski or Beneish score, because the formulas assume an industrial balance sheet. A score can also be missing when the company's filing doesn't report a line item the formula needs. The score block says so in a note instead of showing a number that would look usable but isn't.
Yes for the scores themselves: forensic scores are part of Pro, as are five years of statements plus quarterlies. The free tier gives price, fundamentals, the basic indicators and the next earnings date for the same holdings.