Is the Dividend Actually Covered? A Free-Cash-Flow Check in One Prompt
A dividend yield tells you what a company pays. It doesn't tell you whether the business generated the cash to pay it. Verizon and Pfizer both yield about 6%, and on that number alone they look the same. Over the last four years their cash flow tells two different stories.
The check that answers the question is simple: take free cash flow (operating cash flow minus capital expenditure) and divide it by the cash dividends actually paid. Above 1.0x, the dividend came out of that year's free cash flow. Below 1.0x, part of it came from somewhere else: cash on hand, asset sales or new debt. Do that for several years, add the most recent quarters and the debt trend, and you have a much better picture than the yield gives you.
By hand it's tedious. With Stocklake connected, your AI agent (Claude, ChatGPT or another) pulls the reported statement lines and does the arithmetic in one prompt. Below are three prompts I ran on September 27. Every figure is as of Sept 25 and comes from the companies' reported cash flow statements and balance sheets; the ratios are the agent's arithmetic on those lines, not a precomputed field.
1. Verizon yields about 6%. Is that covered?
Start with one company and make the assistant show its work.
What came back (as of Sept 25)
- The yield: $47.08 per share, a $2.83 annual dividend rate, a 6.0% yield.
- Fiscal 2025, line by line: operating cash flow of $37.14B, minus capital expenditure of $17.46B, gives free cash flow of $19.68B. Cash dividends paid were $11.48B. $19.68B ÷ $11.48B = 1.71x.
- Last four quarters (Q3 2025 through Q2 2026): free cash flow of $20.16B against $11.63B paid, or 1.73x.
- The year it didn't hold: in 2022, capital expenditure was $26.74B, free cash flow came to $10.40B, and dividends paid were $10.81B: 0.96x. Operating cash flow barely moved across the four years ($36.9B - $37.5B). What changed was capex, which fell from $26.7B to $17.5B.
- Debt: total debt of $181.64B at the end of 2025 against $19.05B in cash, so net debt of about $162.6B, down from $173.7B at the end of 2022. That's a little over eight years of 2025 free cash flow. In the first half of 2026 Verizon also spent $3.5B on buybacks and repaid $6.4B more debt than it issued.
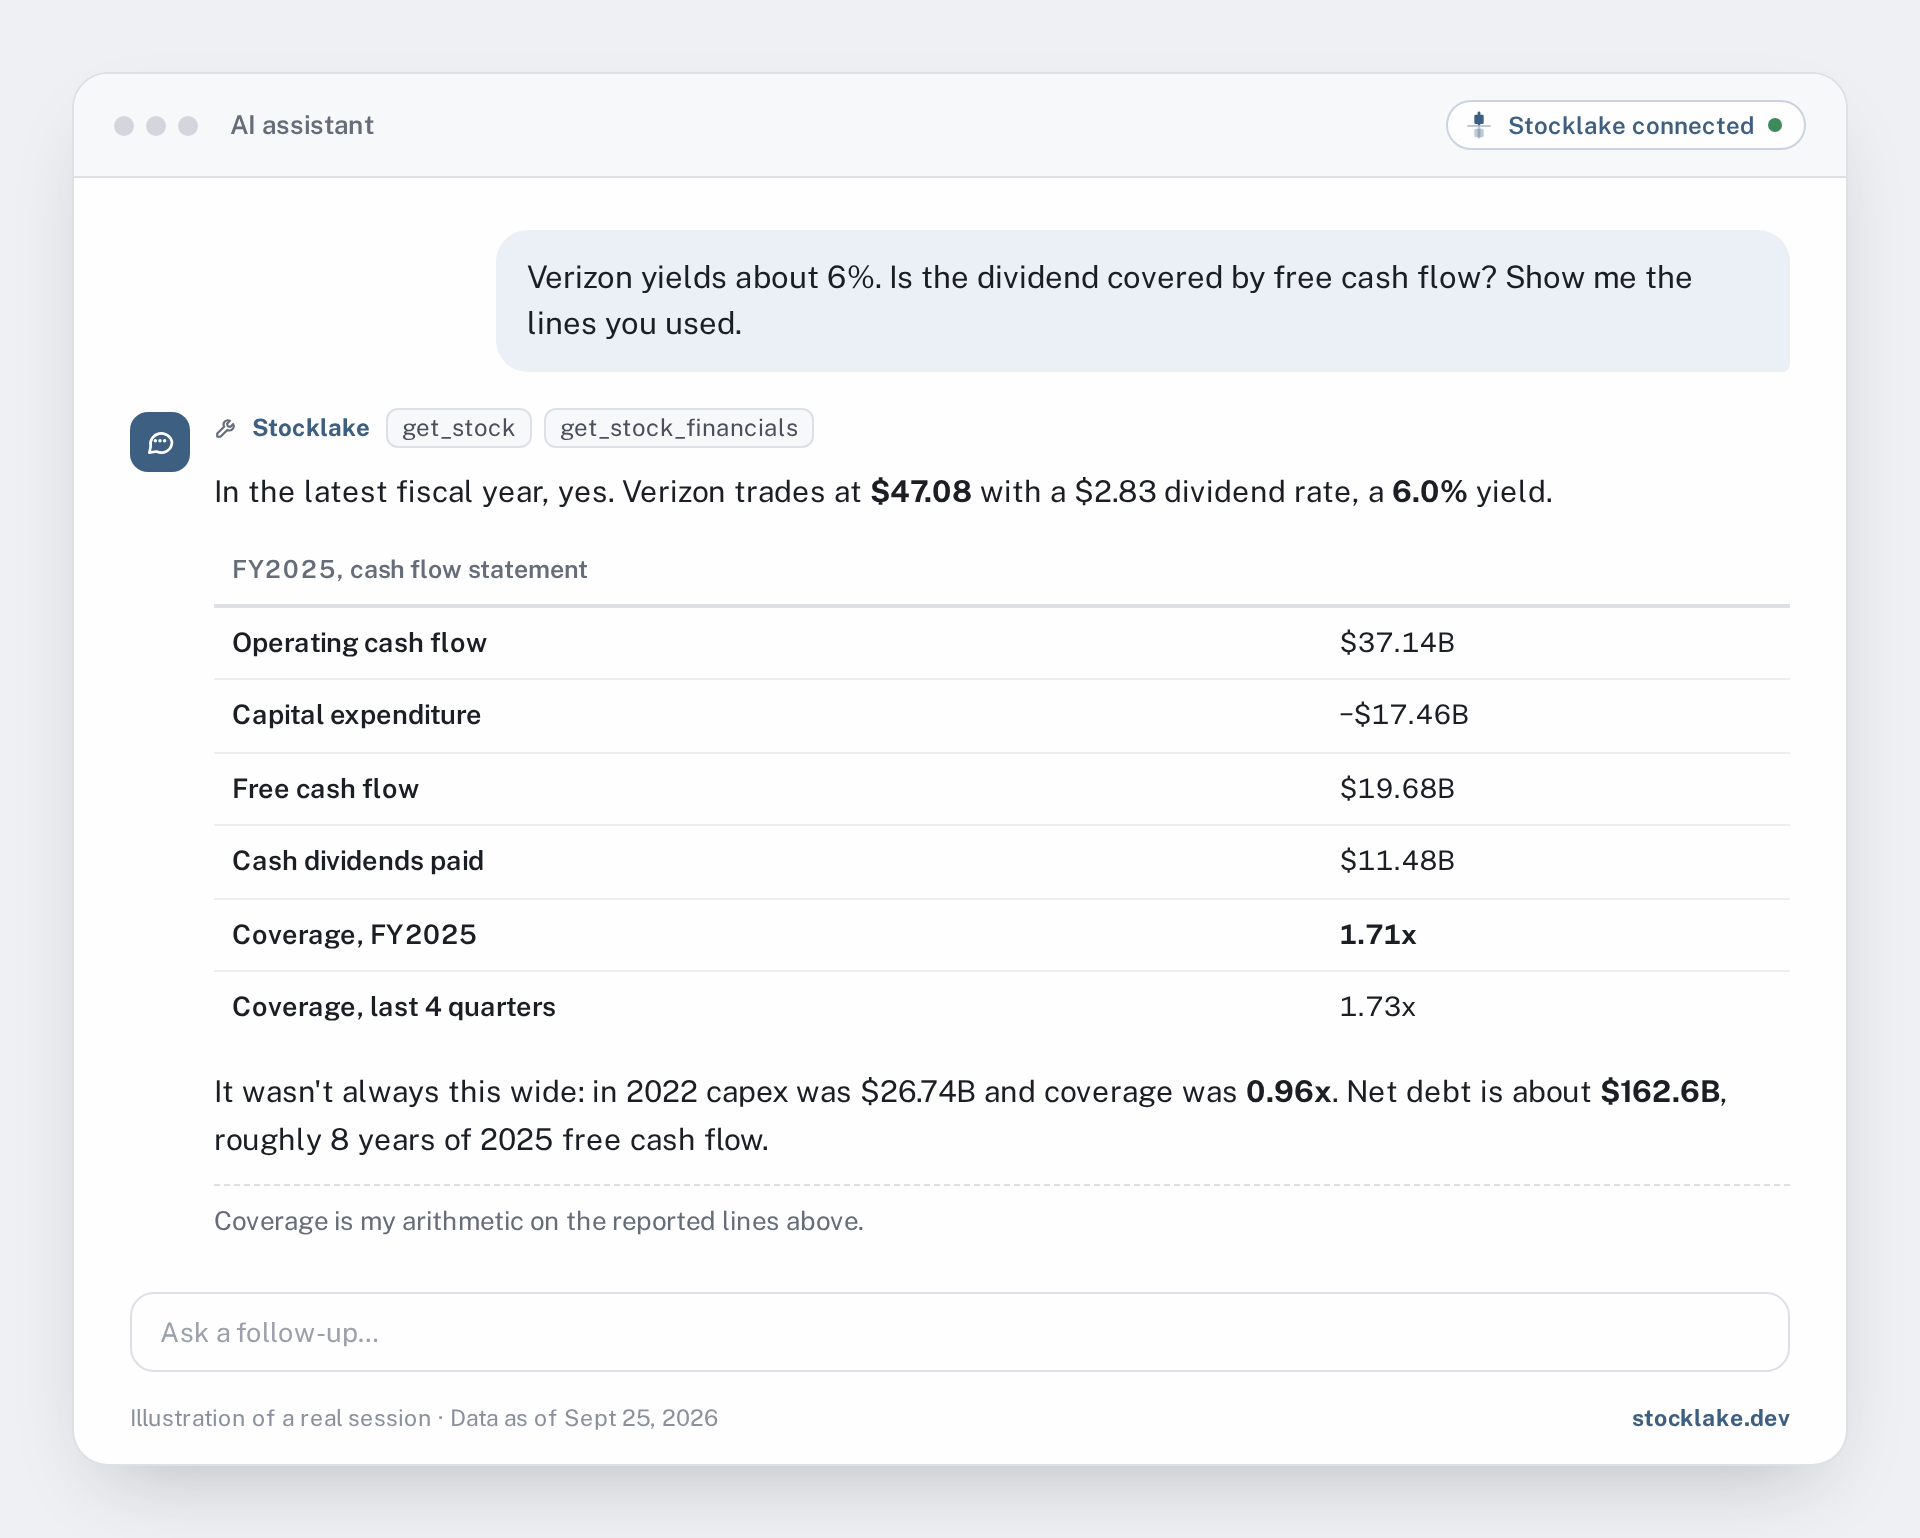
- It shows operating cash flow, capex and dividends paid as separate, dated lines, so you can check the division yourself.
- It uses cash dividends paid from the cash flow statement, not the yield times a share count.
- It gives both the fiscal year and the most recent four quarters.
2. Which year slipped, and why?
One year is a snapshot. The useful version of the question is the trend, and when coverage drops, which line moved.
What came back (as of Sept 25)
- Nike, fiscal years ending May 31: coverage of 2.42x (FY2023), 3.05x (FY2024), 1.42x (FY2025) and 0.91x (FY2026). Free cash flow went $4.87B, $6.62B, $3.27B, $2.18B, while dividends paid rose every year, from $2.01B to $2.41B.
- What moved: operating cash flow fell from $7.43B in FY2024 to $2.87B in FY2026. Capex stayed small ($0.43B - $0.97B). Buybacks dropped from $5.48B in FY2023 to $0.15B in FY2026, so the cash that used to go to repurchases was no longer being spent.
- Nike's balance sheet: total debt of $11.03B against $9.03B in cash and short-term investments, so net debt of about $2.0B, roughly where it was three years earlier ($1.5B). The shares trade at $35.75 with a 4.6% yield; the next report is scheduled for Oct 1.
- Coca-Cola (follow-up), a different pattern: coverage of 1.25x (2022), 1.23x (2023), 0.57x (2024) and 0.60x (2025). Operating cash flow dropped from $11.60B to $6.81B in 2024, and one line explains most of it: the change in working capital was −$6.23B in 2024 and −$7.21B in 2025, against −$0.6B to −$0.8B in the two years before. Capex barely changed.
- Coca-Cola's recent quarters: the last four quarters show $14.30B of free cash flow against $11.06B paid, or 1.29x. That's on the low side, because the Q4 2025 line holds $4.39B, roughly two quarterly payments.
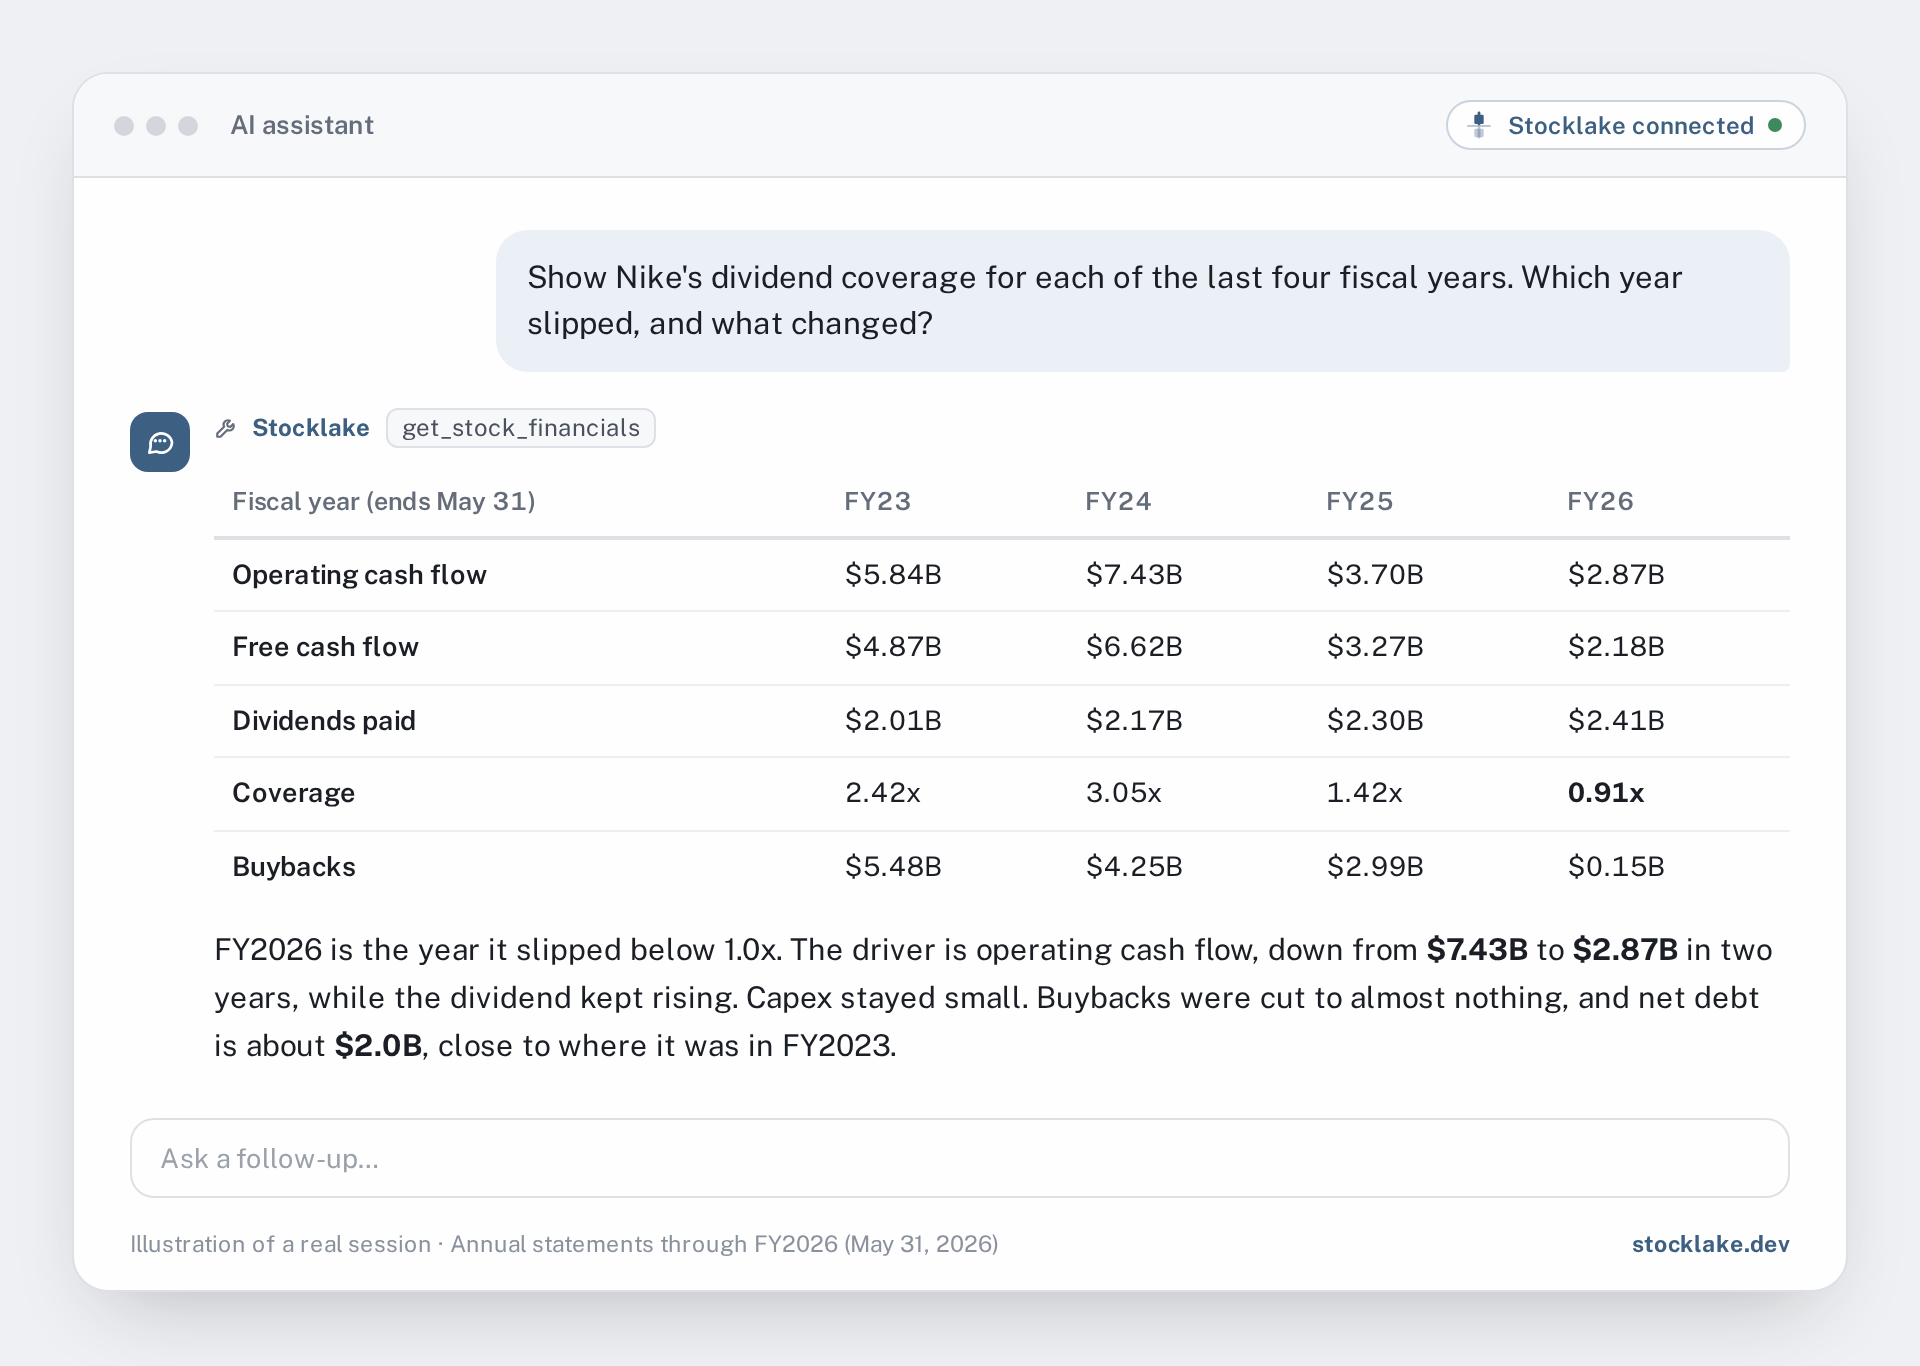
- It names the year coverage fell below 1.0x and labels fiscal years correctly (Nike's end in May).
- It separates the causes: falling operating cash flow, rising capex, or a rising dividend.
- It spots a single line driving the change, like Coca-Cola's working capital, and says the statements show where the cash went while the company's filings explain why.
3. Five dividend payers, one table
Asking for a single table forces the same definition across every company.
What came back (as of Sept 25)
| As of Sept 25, 2026 | Yield | FY 2022 | FY 2023 | FY 2024 | FY 2025 | Last 4 qtrs | Net debt, 2022 → 2025 |
|---|---|---|---|---|---|---|---|
| Pfizer | 6.0% | 2.90x | 0.52x | 1.03x | 0.93x | 1.12x | $12.1B → $50.4B |
| Verizon | 6.0% | 0.96x | 1.17x | 1.68x | 1.71x | 1.73x | $173.7B → $162.6B |
| Nike* | 4.6% | 2.42x | 3.05x | 1.42x | 0.91x | 0.91x | $1.5B → $2.0B |
| Coca-Cola | 2.4% | 1.25x | 1.23x | 0.57x | 0.60x | 1.29x | $27.5B → $29.7B |
| Johnson & Johnson | 2.0% | 1.47x | 1.51x | 1.53x | 1.56x | 1.76x | $17.4B → $27.8B |
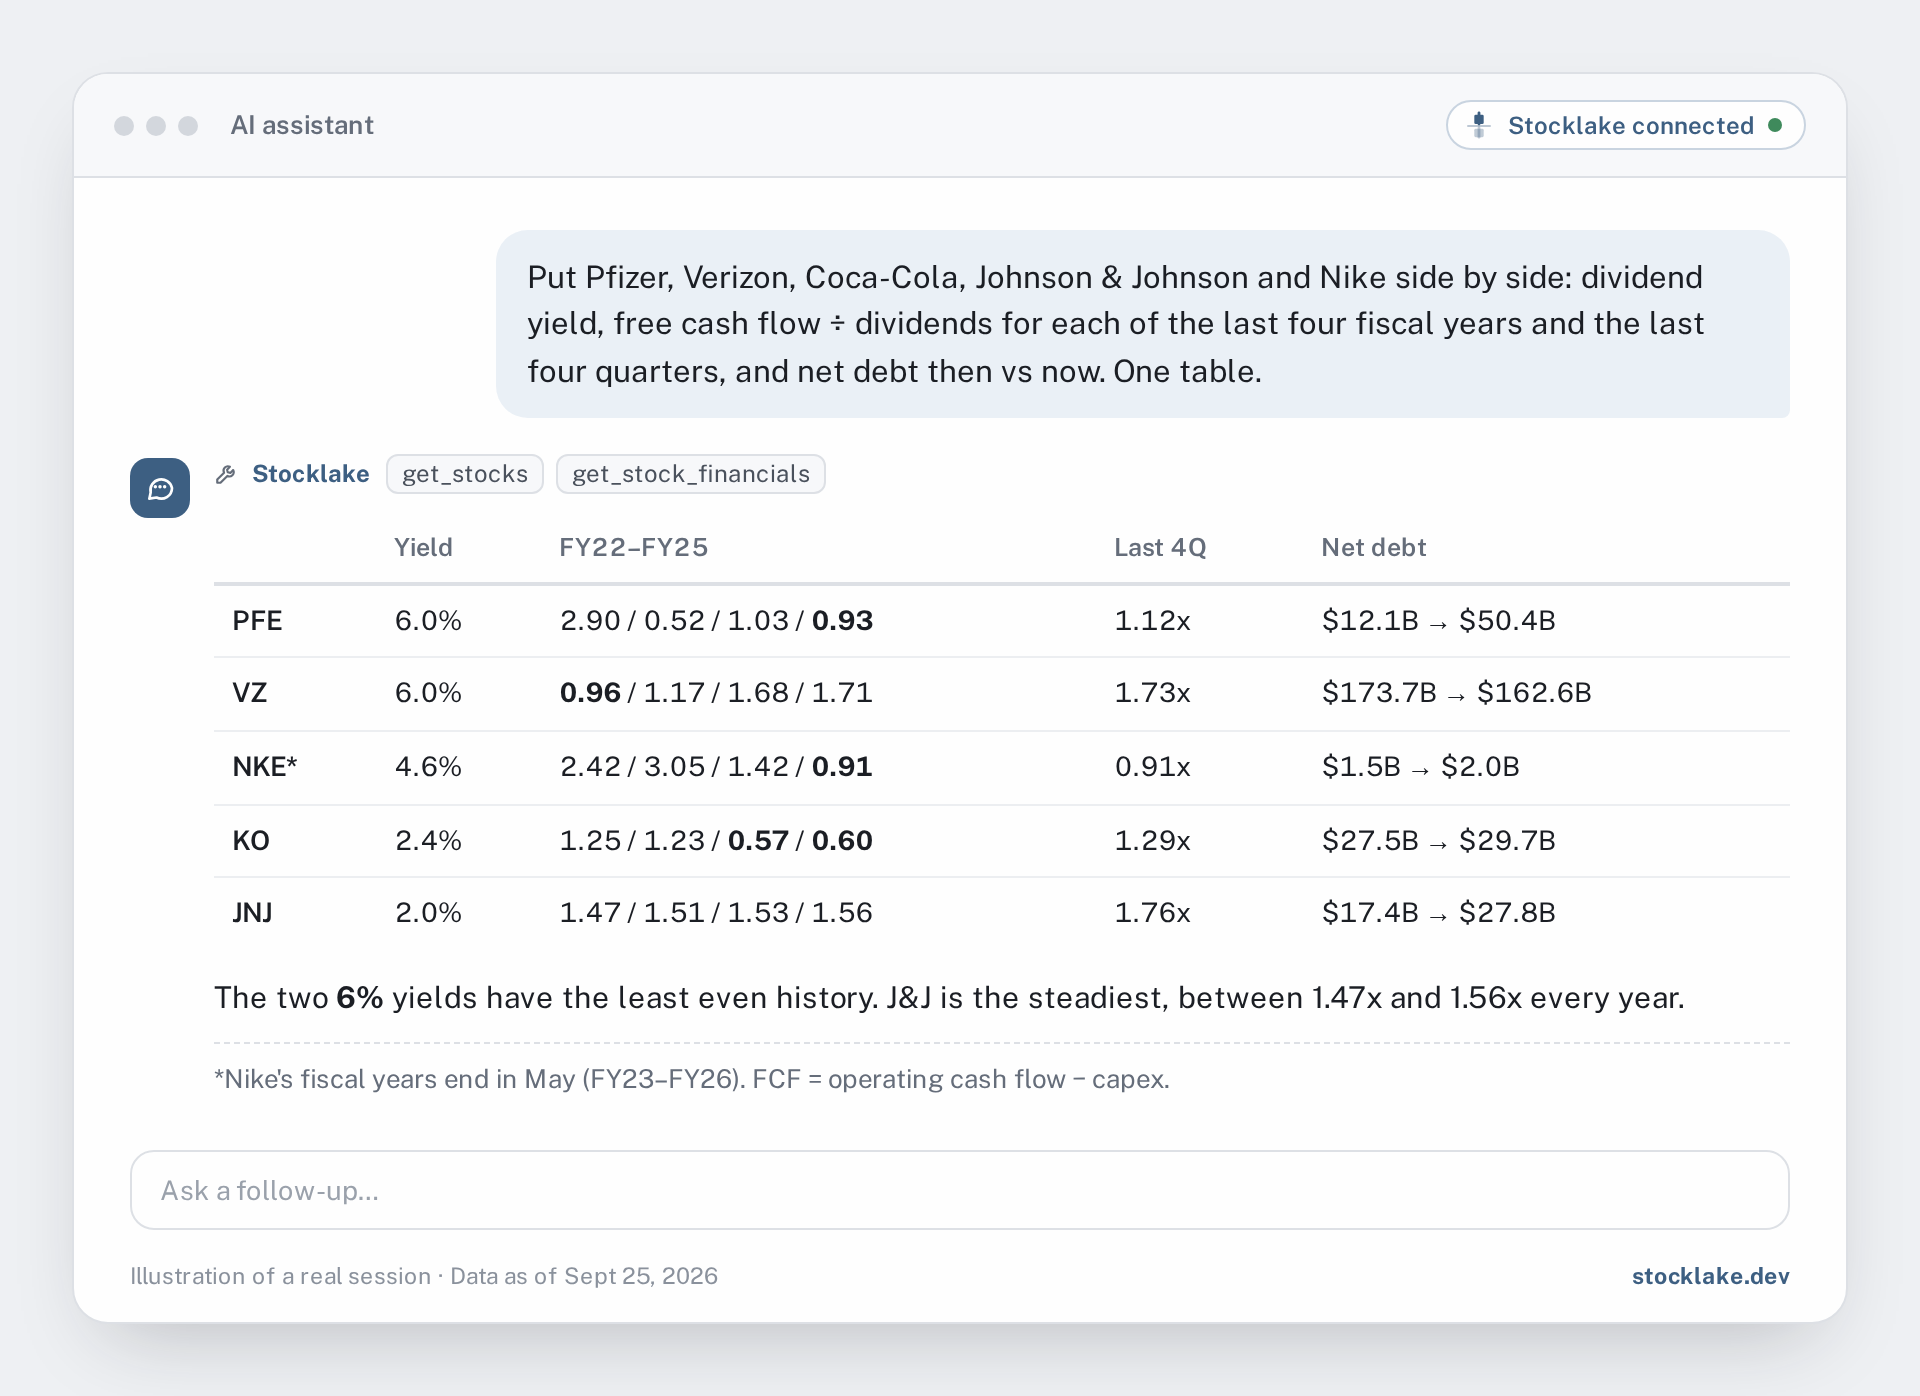
A few things the table shows that the yields don't:
- The two highest yields have the least even history. Pfizer went from 2.90x in 2022, on operating cash flow of $29.3B, to 0.52x in 2023, on $8.7B. In fiscal 2025 it paid $9.77B in dividends against $9.08B of free cash flow ($11.70B operating cash flow minus $2.63B capex). Its most recent quarter was thin: $0.30B of free cash flow against $2.45B paid. Its total debt went from $34.9B to $64.0B over the four years, and the 2023 cash flow statement shows $38.5B of new debt issued that year.
- Johnson & Johnson is the steadiest line: between 1.47x and 1.56x every year, 1.76x on the last four quarters, with free cash flow rising from $17.2B to $19.3B. Its net debt still rose, from $17.4B to $27.8B.
- Debt against cash flow: Verizon's net debt is about 8.3 times its 2025 free cash flow; J&J's about 1.4 times; Pfizer's about 5.5 times; Nike's under one year's worth.
- One definition for every company: operating cash flow minus capex, over cash dividends paid.
- Fiscal year ends labeled, so a May year isn't compared as if it were December.
- No ranking by yield alone, and no “safe” or “unsafe” labels: the numbers, and where they came from.
If Pfizer is the one you hold, the Pfizer-vs-peers post runs the same coverage check against Bristol-Myers, Merck and Gilead, alongside margins and forensic scores.
What the ratio doesn't tell you
- One year under 1.0x isn't a verdict. Companies bridge a gap with cash or borrowing, and cash flow swings with working capital and one-off payments. Look at the run of years and the latest quarters.
- Buybacks compete for the same cash. Ask for them next to dividends; Nike's fell from $5.48B to $0.15B.
- Debt changes the meaning. The same 1.0x reads differently with net debt at one year of free cash flow than at eight.
Free vs Pro for this question
On the free tier you can already ask about a dividend and get the headline numbers. The multi-year check itself runs on the statement lines.
- Price, dividend rate and yield
- Ex-dividend and next earnings dates
- A single trailing free cash flow figure
- Debt-to-equity and margins
- Analyst consensus and recent headlines
- Five years of statements plus quarterlies (the lines this check uses)
- Forensic scores (Altman Z, Piotroski F, Beneish M)
- AI summary and news sentiment
- The full insider transaction list
- Technical rating and the full indicator breakdown
Tips for better answers
- Ask it to cite the rows. “Show me the lines you used” gets you operating cash flow, capex and dividends paid with their dates. If one of them looks off, you can see it immediately.
- Name the definition. The quote data also carries a single summary free cash flow figure that uses a different calculation (for Pfizer it reads $12.5B, while the last four quarters of statement lines add up to $11.0B). Asking for “operating cash flow minus capital expenditure, from the cash flow statement” keeps every company on the same basis.
Setting it up
Stocklake works in Claude, ChatGPT and other MCP clients. You add it once, as a custom connector with the URL https://api.stocklake.dev/mcp, and it's then available in every chat, including on web, desktop and mobile where your client supports connectors. You can start on the free tier without a card and add a Pro key later if you want the multi-year statements. The step-by-step setup for each client is in the docs.
Frequently asked questions
It's a fact about one period, not a verdict. Cash flow swings from year to year with working capital, investment cycles and one-off payments. What matters is the trend over several years, the most recent quarters, and how much debt the company carries while it bridges the gap.
The free tier gives the price, dividend yield and rate, a single trailing free cash flow figure and debt-to-equity. The multi-year check in this post uses the cash flow statement and balance sheet lines. Those lines come from five years of statements plus quarterlies, which is a Pro feature.
No. Stocklake provides market data and research context, including the financial statements companies report. It doesn't generate trade calls, and nothing in this post is a recommendation to buy, sell or short any security.