The Earnings-Week Checklist: Five Things to Ask Your AI Assistant Before a Company Reports
Earnings season is when a stock you own can move 10% in an afternoon. A better habit than skimming headlines the night before is a short, fixed checklist you run on every holding that reports. An AI assistant with live market data can run it from one sentence.
A plain chatbot doesn't know when a company reports this quarter, what analysts expect, or who at the company sold shares last month. With Stocklake connected, your AI agent (Claude, ChatGPT or another) looks those things up first. Below is the checklist I use, followed by three real conversations: finding out which holdings report soon, then running the checklist on Micron and on PepsiCo. The data was pulled on Sept 27; prices are the Friday, Sept 25 close.
- 1. The date and time. Before the open or after the close, and is the date confirmed or an estimate?
- 2. The consensus. Expected EPS and revenue: the bar the report gets measured against.
- 3. The last quarter. The real reported numbers, plus the same quarter a year ago, as a baseline.
- 4. The run-up. How far the stock has moved into the report, in numbers.
- 5. The insiders. Who bought or sold in the months before, with dates, share counts and prices.
1. Which of my holdings report soon?
The first question is a calendar question, asked against your own list of stocks.
What came back (pulled Sept 27)
- Micron: Sept 30, after the close (4:00 pm ET).
- PepsiCo: Oct 8, before the open (8:30 am ET).
- Delta: Oct 9, before the open.
- JPMorgan: Oct 13, before the open, the same morning as Wells Fargo, Citigroup and Goldman Sachs.
- Outside the window: Nvidia reports Nov 17. For Apple, the record still shows its last report on July 30; the next date hasn't been published yet.
All four dates inside the window are marked confirmed. The calendar carries an is_estimate flag on every row; an estimated date is based on past timing and can move by a week or more. With Pro, the assistant can add a short AI read for each name. Micron has an ai_score of 62, PepsiCo 36, Delta 43 and JPMorgan 37. For Delta the flagged risk was that the price sits above its upper Bollinger band; for JPMorgan, pressure on bank stocks from rate and credit worries, plus legal headlines.
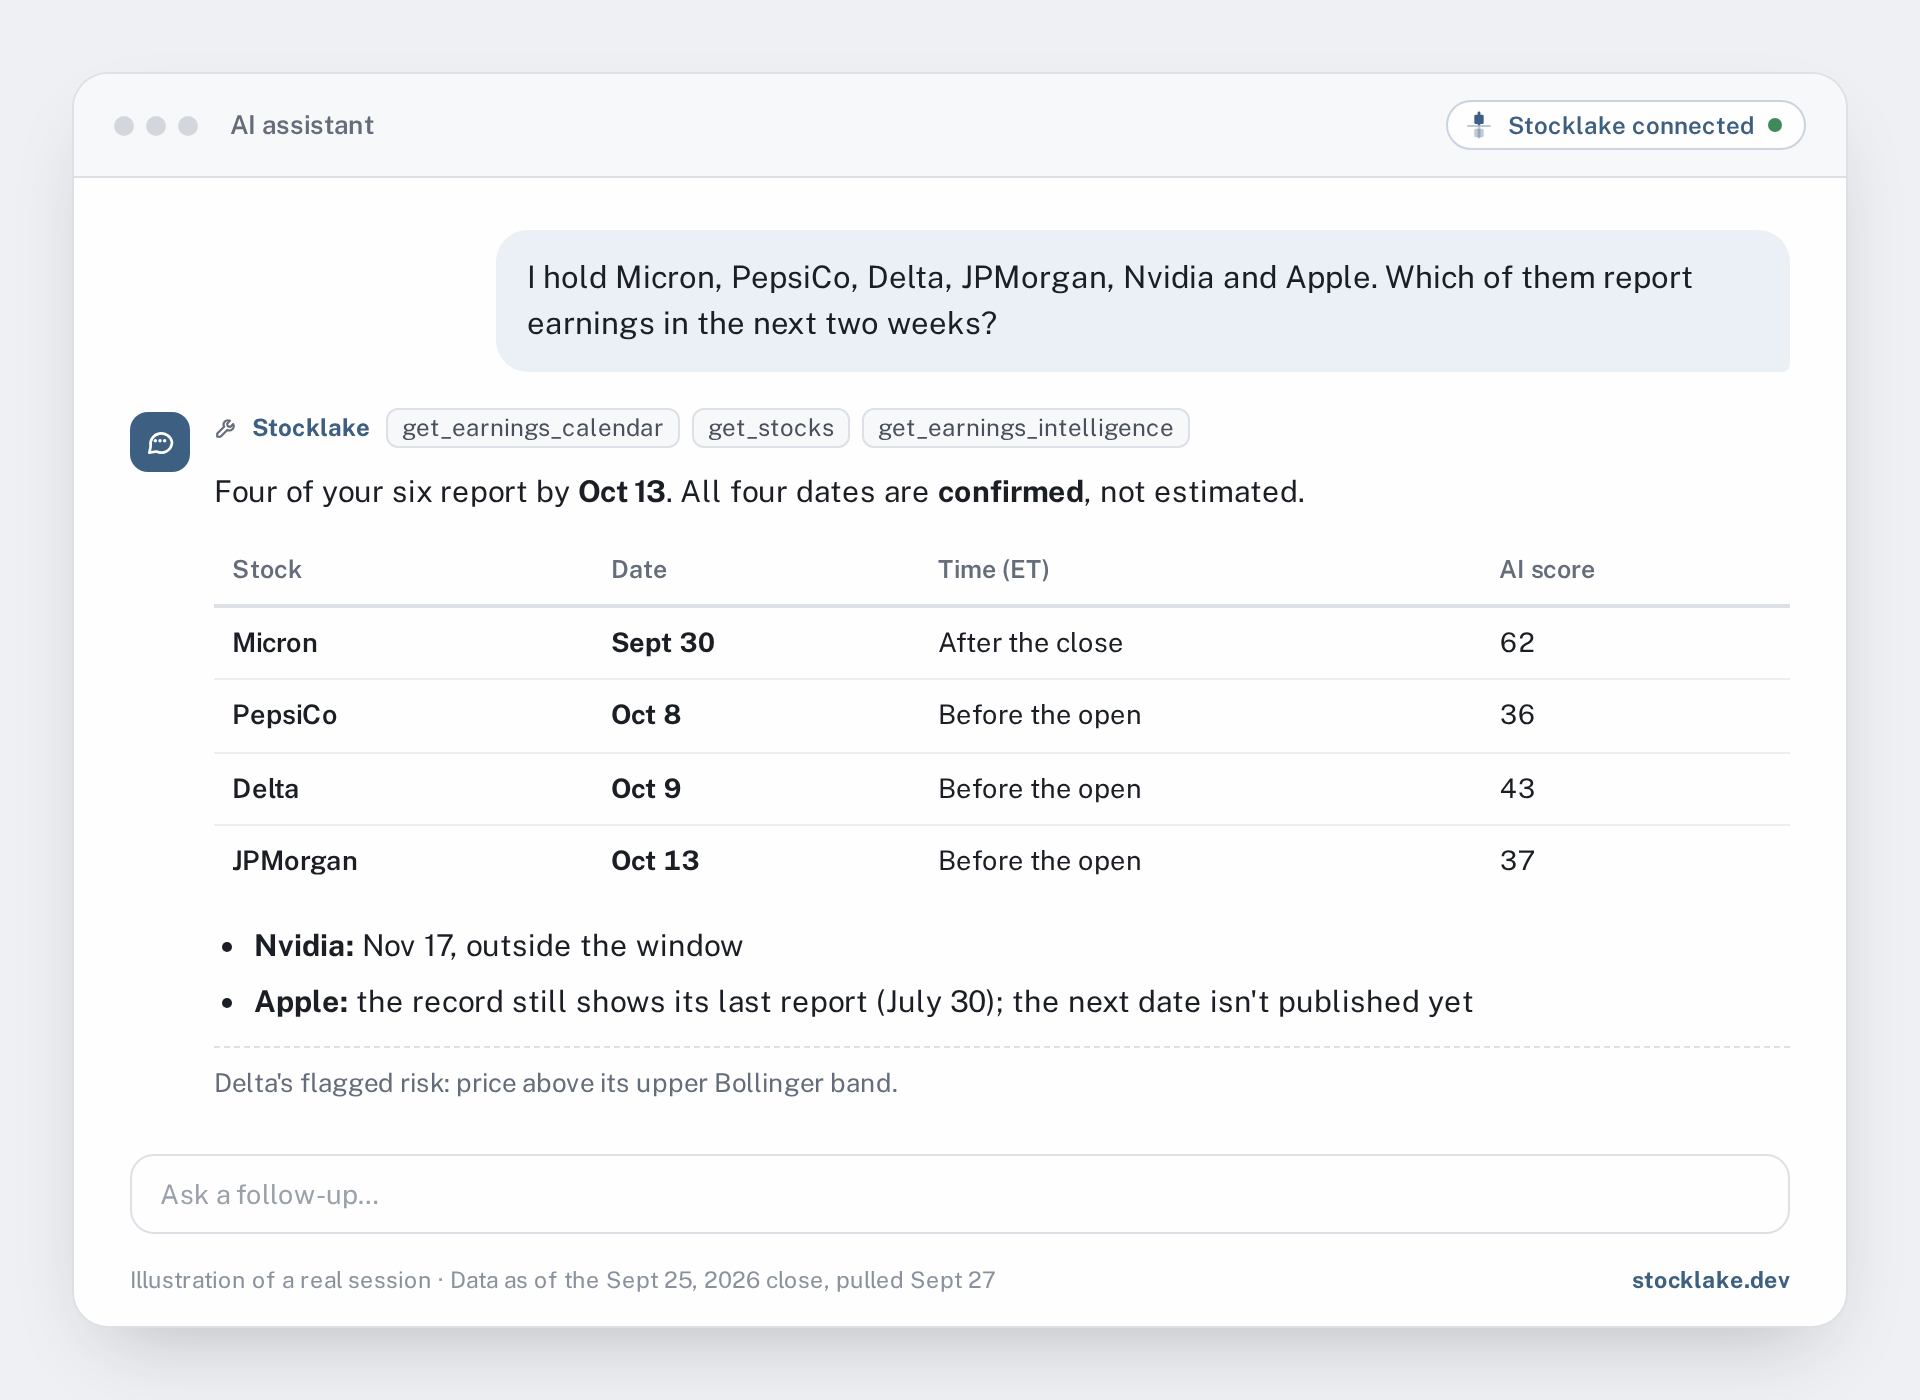
- It gives the time of day, not just the date. A report after the close moves the stock the next morning.
- It says whether each date is confirmed or estimated.
- It flags a date that is already in the past (like Apple's July 30) instead of presenting it as upcoming.
2. The full checklist on Micron
Micron reports Sept 30 after the close, one of the most closely watched reports of the month.
What came back (as of the Sept 25 close)
- 1. Date: Sept 30, after the close. Confirmed.
- 2. Consensus: EPS of about $31.30 on revenue of about $50.62B, per a Sept 22 news item. A Sept 16 article cited $30.89 and about $50.4B, and noted that Micron had guided to about $50B in revenue with an 86% gross margin. So the bar rose by about $0.41 of EPS in one week.
- 3. Last quarter: the quarter ended May 31 brought revenue of $41.46B and diluted EPS of $24.67. The same quarter a year ago, the one this report will be compared with (ended Aug 31, 2025), had revenue of $11.32B and diluted EPS of $2.83. The arithmetic: $50.62B ÷ $41.46B means the consensus expects revenue up about 22% from last quarter, and $50.62B ÷ $11.32B is about 4.5 times the year-ago figure. On EPS, $31.30 ÷ $2.83 is about 11 times.
- 4. Run-up: $1,082.28, up about 591% over 12 months ($156.58 a year earlier) and about 16% over the past month. It is 13.8% below its June high of $1,255 and 63.7% above its 200-day average of $660.98. RSI is 63.2; Williams %R is −12.7, overbought on that measure.
- 5. Insiders: eight sales and no buys between June 26 and Aug 21. The CEO sold 40,000 shares three times: June 26 at $1,158.38, July 24 at $932.25 and Aug 21 at $968.90, about $122.4M together. All eight rows add up to about $182.2M.
- Also on the radar: on Sept 24 the US International Trade Commission voted to open an investigation after a complaint from Netlist.
One detail is worth pointing out. The one-line insider summary that came back described “58 sells” worth $83.0M and put the CEO's July 24 sale at about $6.6M. The transaction rows say eight sales, and the July 24 row is 40,000 shares at $932.25, about $37.3M. The summary is written on its own schedule and can lag the filings. That's why the checklist asks for rows, not a sentence.
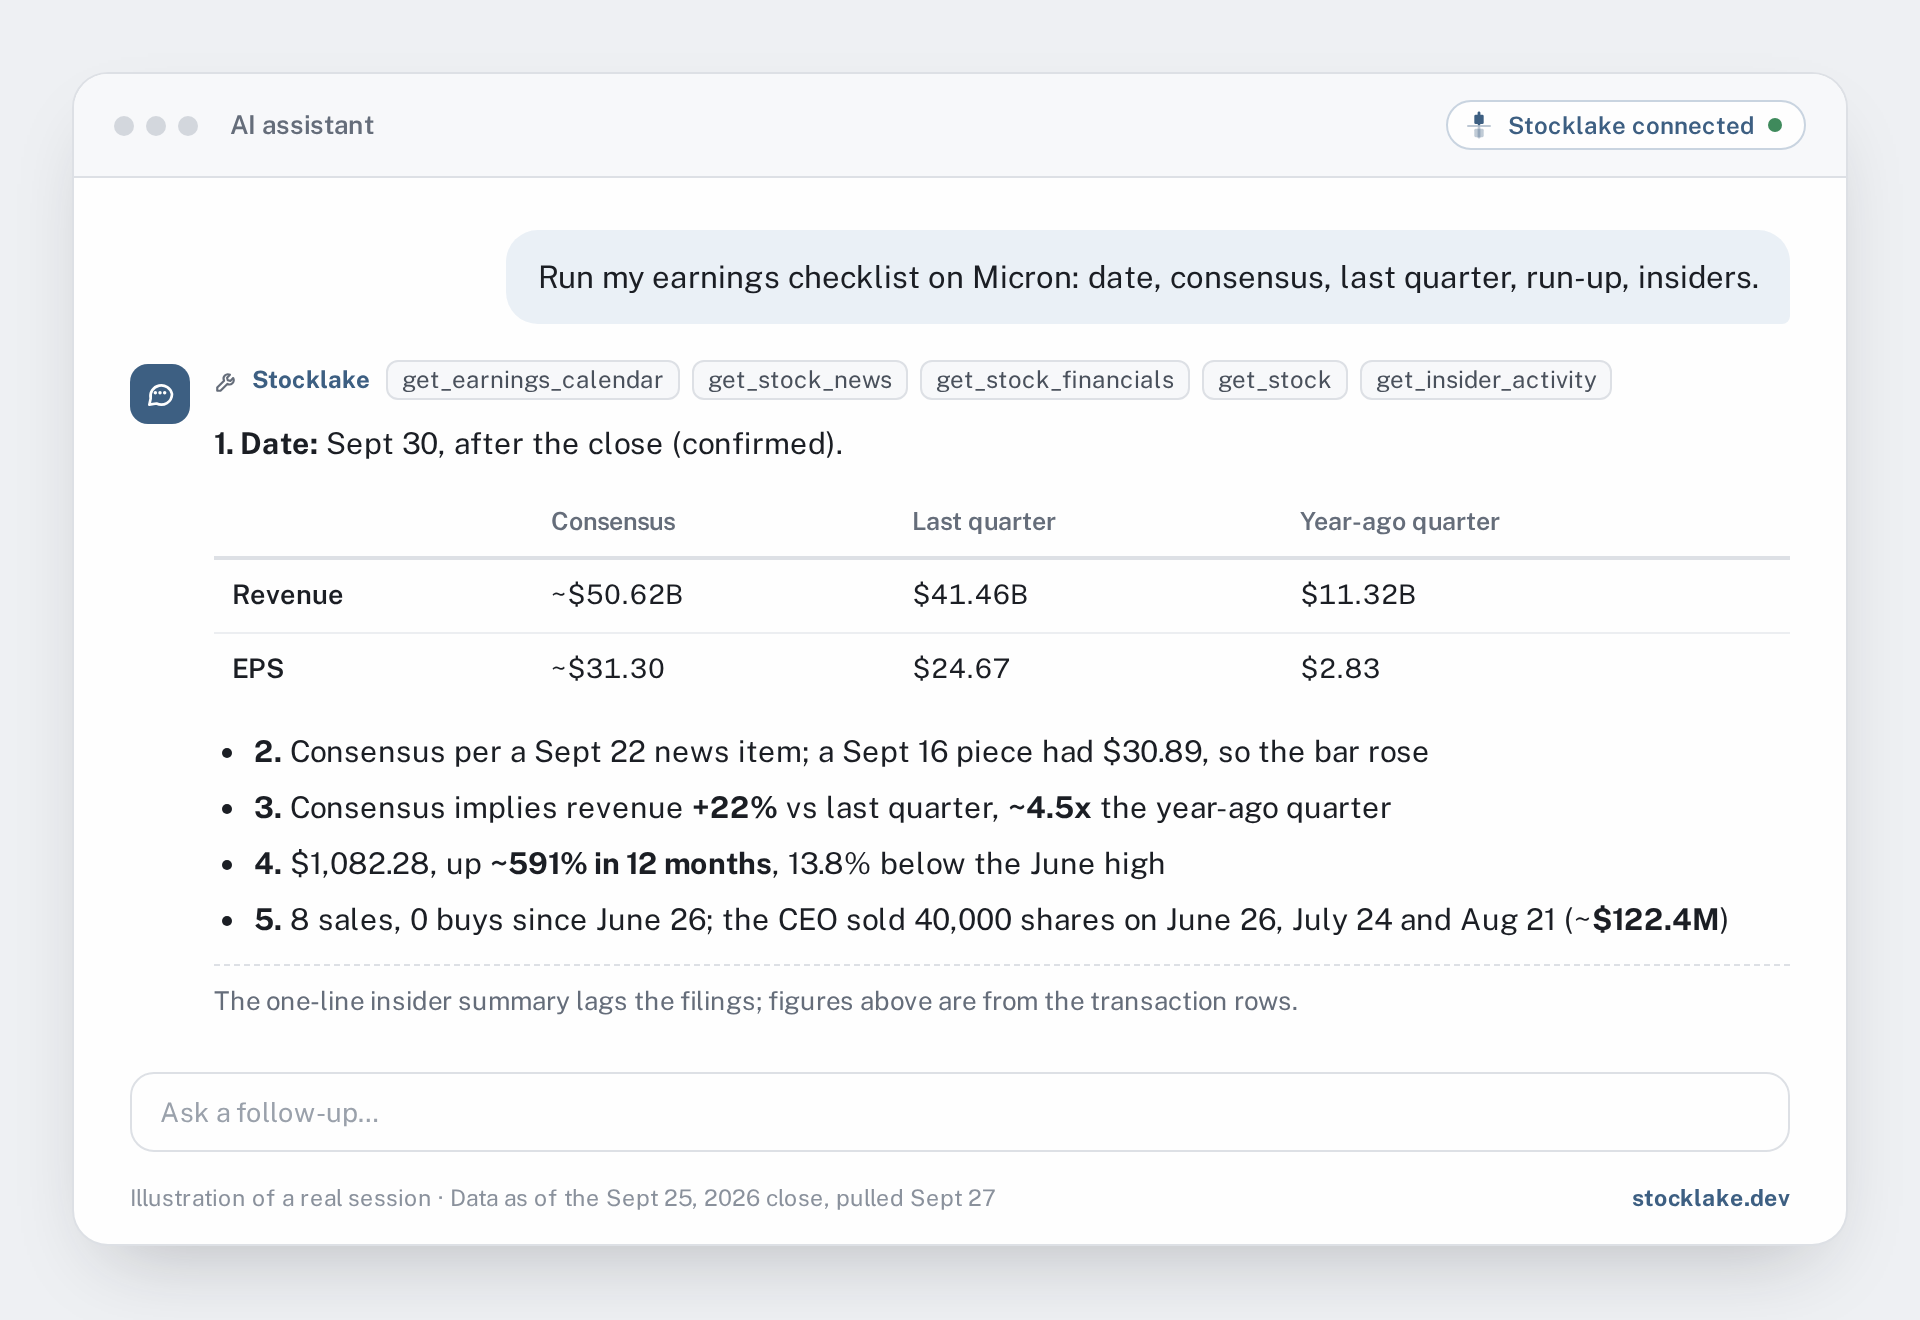
- It names the source and date of the consensus number, and notices when the number has moved.
- It shows both baselines: last quarter and the same quarter a year ago. The consensus is usually measured against the second.
- It does the division in the open, so you can check it.
- On insiders, it cites the rows (name, date, shares, price) and says so when the summary and the rows disagree.
3. The same checklist on PepsiCo
Micron is the easy case, with plenty of coverage. PepsiCo reports Oct 8 and is almost the opposite: a stock that has drifted lower into the report. The same five questions also show where the checklist has gaps.
What came back (as of the Sept 25 close)
- 1. Date: Oct 8, before the open. Confirmed.
- 2. Consensus: not found. None of the 20 news items from the past 30 days stated a quarterly EPS or revenue consensus. The data does include a forward EPS of $8.96, but that is a full-year figure, not the bar for this quarter. Analysts rate the stock “hold”: 22 analysts, mean target $153.86.
- 3. Last quarter: the quarter ended June 30 brought revenue of $24.18B, up 6.4% from $22.73B a year earlier, and diluted EPS of $2.18 versus $0.92. That EPS jump comes off a low base: the year-earlier quarter's EBITDA was $2.81B against a normalized $4.67B, which points to one-off charges. The same quarter a year ago, the one the Oct 8 report will be compared with, had revenue of $23.94B and diluted EPS of $1.90.
- 4. Run-up: the move has been down, not up. $128.63 is 25.0% below the 52-week high of $171.48 and 1.4% above the 52-week low of $126.90. The stock is down about 9% over the past month and 5.7% over 12 months, below both its 50-day ($137.83) and 200-day ($146.43) averages, with RSI at 26.8. In the news: a new 52-week low on Sept 16, and a Sept 24 report that PepsiCo is reversing earlier price cuts on snacks after North American food revenue fell 2% last quarter.
- 5. Insiders: one sale, no buys. General Counsel David Flavell sold 2,900 shares at $139.54 on July 27, about $405,000. About 81.5% of shares are held by institutions.
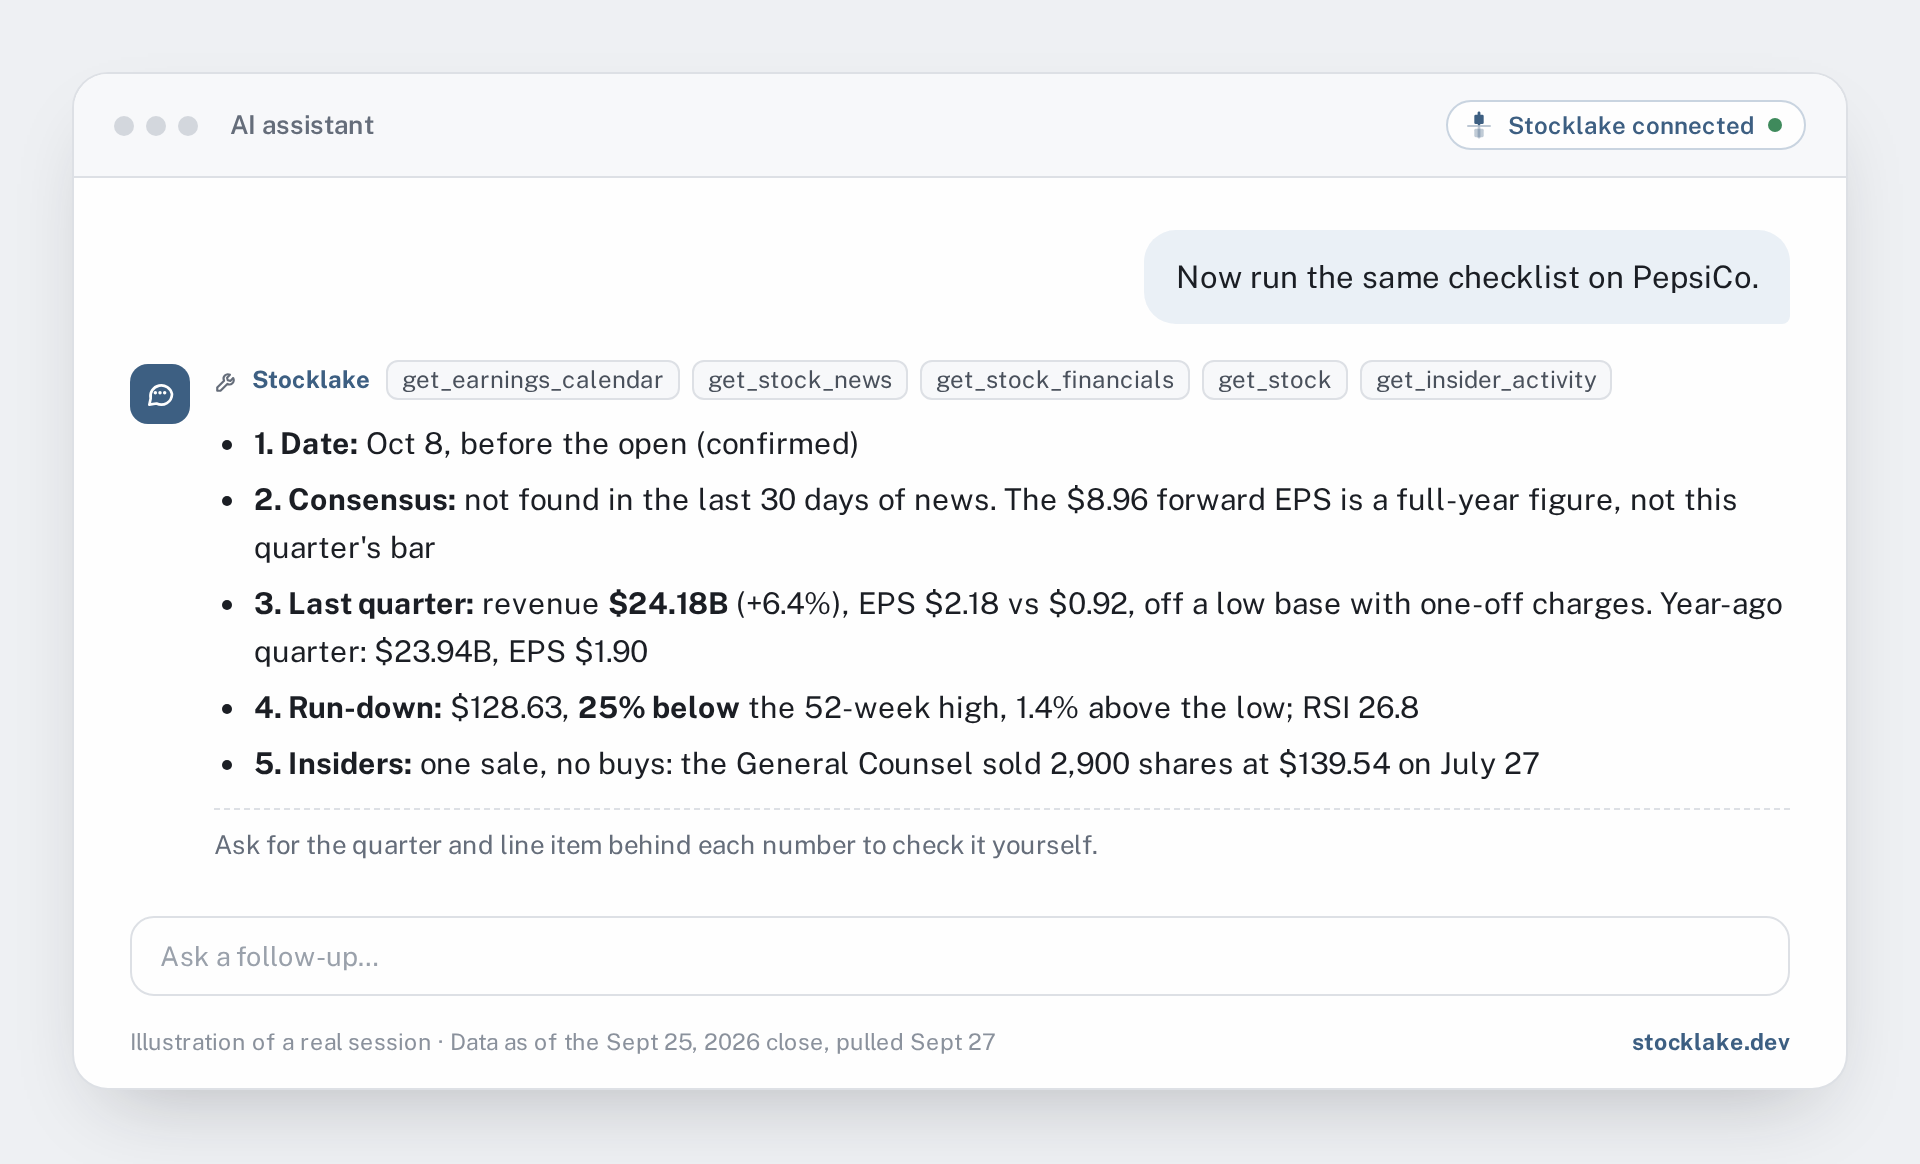
- It says “not found” for the consensus instead of filling the gap with a guess or a full-year number.
- It explains a jump that looks too good, like EPS going from $0.92 to $2.18, by pointing at the year-earlier charges.
- It reports a run-down as plainly as a run-up. The question is how much news is already in the price, in either direction.
Free vs Pro for this checklist
The earnings calendar is free, and so is the price data you need for the run-up. The parts that need the filings and the news text are Pro.
- Earnings dates, times and the confirmed/estimated flag
- Price, 52-week range, RSI and moving averages
- Daily price history, for the run-up
- Analyst consensus rating and mean target
- Recent plain headlines
- Earnings intelligence: AI score and risks per report
- AI news summaries, where consensus figures usually appear
- Five years of statements plus quarterlies
- The full insider transaction list
- Relative strength and the extra indicators (Williams %R and others)
Tips for better answers
- Ask for the rows. For insiders, “cite the transaction rows” gets you name, date, shares and price. For the baseline, “cite the quarter and the line item” tells you which statement row each number came from.
- Ask where the consensus came from. A consensus number from a news item has a date and a source. If the assistant can't name one, it should say so.
- Run it again the day before. Estimates move in the last week, as Micron's did. The whole checklist takes one sentence to rerun.
Setting it up
Stocklake works in Claude, ChatGPT and other MCP clients. Add it once as a connector, using the server URL https://api.stocklake.dev/mcp, and it's available in every chat after that. You can start on the free tier without a card and add Pro later. The step-by-step setup for each client is in the docs.
Frequently asked questions
A confirmed date has been announced by the company. An estimated date is projected from past reporting patterns and can move. Stocklake's earnings calendar marks every row with an is_estimate flag, so you can ask the assistant to show it.
In these conversations it came from dated news items that quoted the analyst consensus. When no news item states one, a good answer says so rather than guessing.
No. Stocklake provides market data and research context: prices, technicals, news, insider filings and financial statements. It doesn't generate trade calls, and nothing in this post is a recommendation to buy or sell any security.
The free tier covers the report date and time, whether it's confirmed, and the price move into the report. Pro adds the consensus from AI news summaries, five years of statements plus quarterlies for the baseline, the full insider transaction list and earnings intelligence.